Mac Vet Rev 2014; 37 (1): 43 - 47
 10.14432/j.macvetrev.2013.10.002
Received: 22 July 2013
Received in revised form: 09 October 2013
Accepted: 16 October 2013
Available Online First: 15 November 2013
Published on: 15 March 2014
Keywords: oxidative stress, dROM test, poultry
Oxidative stress has been defined as a loss of counterbalance between free radical or reactive oxygen species production and the antioxidant systems. Oxidative processes represent the main causes for meat quality deterioration. In addition, oxidative stress is increasingly discussed as being related to health (for review see 1, 2) and has been proposed as a welfare parameter (3). There are basically three different methodological approaches to characterize oxidative stress: 1) Measuring the anti-oxidative capacity (either by evaluating individual components with anti-oxidative properties, e.g. tocopherol or glutathione peroxidase, or by assessing these components in a summative mode, i.e. as total anti-oxidative capacity. 2) Quantifying the oxidative damage in organic molecules; hereby monitoring lipid peroxidation via measuring thiobarbituric acid reactive substances (TBARS) is probably the most commonly applied test system in poultry science (4, 5, 6). 3) Indirect assessment of free radicals via quantification of early products of oxidation such as hydroperoxides. The latter approach has become available only recently and is based on the concept that the amount of organic hydroperoxides is related to the free radicals from which they are formed (7, 8). The test takes advantage of the capacity of hydroperoxides to generate free radicals in the presence of transition metals (e.g. Fe) which act as catalyzers. When free radicals react with a chromogenic substance, they develop a colored complex that can be measured photometrically. Reference values have been established in humans and relationships with various diseases have been documented so far (9, 10, 11). The test, called dROMs test (detection of reactive oxygen metabolites) has already successfully been applied for livestock animals and a number of data is now available for non-human mammals (3, 12, 13). We aimed to establish this test in our laboratory and to evaluate its relationship with other parameters indicative for oxidative stress in chicken. The test turned out to work well with porcine, equine, and bovine samples, but not with chicken sera. We therefore compared sera from other poultry species and herein report the limitations we observed for the application of the dROMs assay in poultry.
Blood was collected from laying hens, broilers, from turkey, duck, goose, pheasant, pigeon, and guinea fowl via puncture of the Vena basilica. In addition, blood was collected during slaughter from geese and broilers. Measurements were done in whole blood or in serum. For comparative purposes, blood serum from dairy cows and horses was used. For the preparation of serum, blood was allowed to clot at 4°C and was then centrifuged at 4°C and 3,000 x g. Serum was then removed and stored at -80°C until assayed.
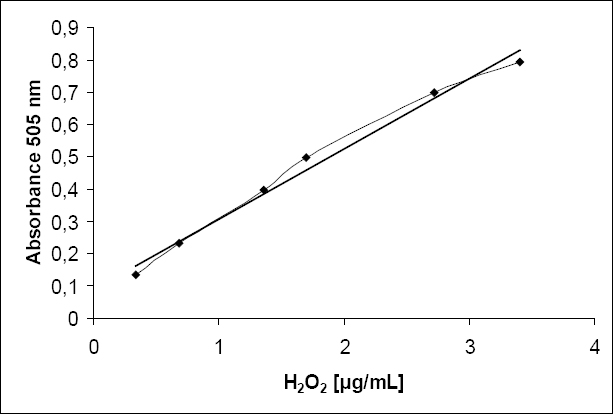
A spectrophotometric method, originally presented by Alberti et al. (8) was applied, in which N,N-diethyl-para-phenylendiamine (DEPPD) is used as chromogen. The alkoxy and peroxy radicals formed in the degradation of hydroperoxides brought about by transition metals in acidic conditions covert DEPPD to its corresponding radical cation DEPPD·+ with can then be quantified at 505 or 549 nm. The concentration of the colored dye is directly proportional to the concentration of hydroperoxides. The test can be performed according to either a kinetic or an end-point analysis. We herein used the end point analysis similar to the protocol of Trotti et al. (14). H2O2 was used as standard and for the generation of a standard curve, a range of 0.4 μg/ml (0.013mM) to 4 μg/ml (0.13 mM) H2O2 was incubated in 10 μL volumes together with 10 μL chromogen (3.7 x 10⁻¹ M N,N-Diethyl-1,4-phenylendiammomiumsulphate, Merck, Darmstadt, Germany), 10 μL of 6 mM FeSO4 (Merck) and 0.97 mL acetate buffer (0.01 M, pH 5.0) for 2 h at 37 °C. After cooling for 10 min in an ice-bath, the absorption was determined with a spectrophotometer (Hitachi U-2000, Mannheim, Germany) at 505 nm. Water was used instead of H2O2 as blank and the absorbance value of the blank was subtracted from those of the standard and the samples. The assay variation was assessed by repeated measurements (n = 17 and n = 14, respectively) of two bovine serum samples. The linearity of the assay was evaluated with bovine and equine blood serum and with serum obtained from various bird species in a range of 5 to 200 μL. The values obtained were then calculated from the standard curves using linear regression and were finally expressed as μg/ml H2O2 equivalents.
The standard curves demonstrated a linear relationship between absorption measurements and the amount of H2O2 (Fig. 1).
Figure 1. Representative standard curve using different concentrations of hydrogen peroxide (H2O2). The regression equation was y = 0 088 + 67,333 x with r = 0.99.
Using bovine samples, the linearity of the assay was established in a range between 5 to 40 µL serum (Fig. 2).
Figure 2. Evaluation of assay linearity using different volumes of serum obtained from the following species: Cattle, Horse, Chicken (broiler), Goose (Demonstration of regression lines is limited to the samples for which linearity could be established)
The coefficients of variation obtained from the two bovine control samples were 2.76 % and 2.88 %, respectively. The limit of detection was defined as the H2O2 concentration that yielded readings significantly different (p < 0.05) from the blank value measured by using H2O and corresponds to the lowest standard concentration of 0.4 µg/mL H2O2. Comparing the H2O2 equivalents measured in 10 uL serum volumes from bird species, markedly lower values than in bovine serum were observed. In most cases the values were below the limit of detection. Using different amounts of the different bird sera, linearity could not be confirmed. From the various bird species assayed, only goose samples yielded a short linear range, all other bird sera could not be validly assayed (data not shown). Evaluation of assay linearity using different volumes of serum obtained from cattle, horse, goose, and chicken is demonstrated in Fig. 2. To substantiate our initial observation, that the dROMs test can not be used for chicken serum, we also tested the commercially available kit (Callegari, Parma, Italy) according to the manufactures instruction both with whole blood and with serum, and obtained the same result of lacking linearity. In consideration of serum constituents that differ between birds and mammals, we also tested the effect of assaying the standard curves in presence of 12.5 µM uric acid [final concentration, i.e. corresponding to 1.25 mM in undiluted serum thus slightly exceeding reference values reported for bird species that reportedly range from 0.2 to 0.8 mM (14, 15)]. However, the OD readings of the standard curve were not impaired by addition of uric acid to the assay system (data not shown).
We previously used the dROM test successfully with bovine, porcine, equine, and canine whole blood and serum (16, 17, 18, 19, 20) but noted that the test cannot be validly used with chicken serum. The same observation was confirmed when using the commercially available version of the dROMS kit and we thus conclude that this test cannot be used for chicken whole blood or serum. In the only report about the use of the dROM test in chicken (21), we could find in the literature, no data about the validity of the assay for this matrix were provided, and the values reported were out of the linearity range of d-ROMs as assessed in a comparison of different methods about oxidative stress tests (22).
Our results indicate that matrix components being exclusively present in blood serum of most of the poultry species tested, severely interfere with the dROMs test and thus prohibit the valid application of this test principle for these species. One of the serum components for which a marked difference between bird and mammalian serum is well-known, is uric acid. In birds, the metabolism of proteins and amino acids results in the production of uric acid, and not as in mammals, of urea (23). Recent studies revealed that uric acid has been proposed to be the dominant antioxidant in birds (24, 25). Decreasing uric acid production in birds by approximately 33% causes an increase in oxidative stress, as evidenced by increased accumulation of markers of reactive species mediated tissue damage (26). Uric acid is an antioxidant because it can inactivate an oxidant by an electron transfer before the oxidant can react with the targeted biological molecule (27). This enhanced ability to scavenge hydroxyl radicals may contribute to the reduction in markers of reactive species-mediated tissue injury observed in broiler chickens with elevated plasma uric acid concentrations (15). Stinefelt et al. (24), using Electron spin resonance spin trapping technique, adding uric acid to the reaction mixure to final concentration ranged from 0.0 to 3.5 mM reported effective reducing of spin adduct signal intensity over 50% with 3.5 mM uric acid. Other authors reported that uric acid may have a stimulatory effect on lipid peroxidation at higher concentrations (28). However, there was no effect of adding the uric acid to the assay system. As already expected from the results with goose samples, uric acid can thus be excluded as the interfering component. Methods to specifically circumvent this problem can presently not be proposed: any approach to fractionate or extract serum will inevitable alter the oxidative status and will thus adulterate the results.
© 2014 Sauerwein H. This is an open-access article published under the terms of the Creative Commons Attribution License which permits unrestricted use, distribution, and reproduction in any medium, provided the original author and source are credited.
We thank Ms. Barbara Heitkönig for excellent technical assistance. The scholarship of the German Academic Exchange Service (DAAD) awarded to Mr. Dimitar Nakov is gratefully acknowledged.
The authors declared that they have no potential conflict of interest with respect to the authorship and/or publication of this article.
Macedonian Veterinary Review. Volume 37, Issue 1, Pages 43-47, p-ISSN 1409-7621, e-ISSN 1857-7415, DOI: 10.14432/j.macvetrev.2013.10.002, 2014