
INTRODUCTION
Nitrofurans are broad spectrum antibacterial agents known as Schiff’s bases, which are derivates of nitrofuraldehyde. In veterinary medicine, it were used in the treatment of gastrointestinal and dermatological infections in beef, pork, poultry, fish and shrimp, and also applied as a contribution to the systemic and feed as growth promoters. In addition, nitrofurans were used in the treatment of bacterial infections in bee colony health (1).
Nitrofurans have been prohibited from use in food-producing animals in the European Union and most countries due to public health and safety concerns, particularly in relation to the carcinogenic potential of either the parent compounds or their metabolites (2). The use of nitrofurans in food-producing animal was prohibited in Turkey (3).
A minimum required performance limit (MRPL) for nitrofurans is set in European Union for the metabolites in poultry meat and aquaculture products at the level of 1 μg kg-1 for all metabolites (4).
Analytically, residues are checked only for marker metabolites of the 4 nitrofuran chemicals, in particular: 3-amino-2-oxazolidinone (AOZ) for furazolidone, 3-amino-5-methylmorpholino-2-oxazolidinone (AMOZ) for furaltadone, 1-aminohydantoin (AHD) for nitrofurantoin and semicarbazide (SEM) for nitrofurazone (5).
Several methods have been reported in the analysis of nitrofuran metabolite in food samples. These include thin-layer chromatography (TLC) (6), high performance liquid chromatography diode-array detector (HPLC DAD) (7) and UV detector (8, 9), liquid chromatography-mass spectrometry (LC-MS/MS) (10, 11, 12). LC-MS/MS analyses were considered very sensitive and commonly used the confirmatory analysis.
In the current study, a method was devoloped and validated for quick confirmatory analysis of nitrofuran metabolites (AOZ, AMOZ, AHD and SEM). All samples were acidic hydrolised followed by derivatisation with nitrobenzaldehyde and liquid-liquid extracted with ethylacetate. The quantitative and confirmatory determination of nitrofuran metabolites was performed by liquid chromatography/electrospray ionisation tandem mass spectrometry (LC/ESI-MS/MS) in the positive ion mode.
MATERIAL AND METHODS
Reagents and standards
3-amino-2-oxazolidinone (AOZ), 1-aminohydantoin (AHD), AMOZ-d5, (C13)3-AHD, C13N15-N15-SEM, 2NP-AOZ, 2NP-AMOZ, 2NP-AHD and 2-nitrobenzaldehyde (2-NBA), 3-amino-5-morpholinomethyl-2-oxazolidinon (AMOZ), semicarbazide hydrochloride (SEM), AOZ-d4, 2NP-AOZ-D4, 2NP-AMOZ-D5, 2NP-(C13)3–AHD and 2NP-C13N15-N15-SEM were obtained from Dr. Ehrenstorfer and Witega. The purity of all compounds was greater than 99%.
Methanol (MeOH) and ethylacetate (LC grade), hydrochloric acid (HCl), dimethylsulphoxide (DMSO), n-hexane and potassium hydrogen phosphate were supplied by Merck. The water was purified with a from a Milli-Q purifying system (Elga PureLab Prima).
Individual standart stock solutions of 1 mg/mL were prepared in methanol, but SEM was prepared in DMSO. Working solutions of 10 ng/mL were diluted by methanol. All standard stock soutions were stored -20 ºC, and the working solutions were stored in refrigerator.
The concentration and content of mix standard solution were used to spiked samples with AMOZ, AOZ, AHD and SEM at a 8, 16, 20 and 20 ng/mL respectively. The concentration and content of internal mix standard solutions were used AOZ-d4, AMOZ-d5, (C13)3-AHD and C13N15-N15-SEM at a 40, 40, 100 and 100 ng/mL, respectively.
Sample preparation
Collected samples for validation were known to be negative in the screning analysis within the national program for residues control in Turkey. Only, the milk samples were centrifuged at 3500 g, +4ºC, 15 min and upper the fat layer was removed before extraction.
Two grams or 2 mL homogenised samples (milk, honey, poultry meat and fish) were weighed into 50 mL polypropylene centrifuge tubes. Standard spiking solution mix (50, 100, 150 and 200 µL), internal standard solution mix (100 µL) and 5 mL of 0.1 M HCl were added. The extraxtion tube was shaken for 2 min by vortex. 2-nitrobenzaldehyde (2-NBA) (50 mM, 300 µL) were added and the mixture shaken for 2 min by vortex. The tube were capped and incubated overnight (16 h) in the 37ºC temperature. After derivatization, the samples were cooled in room temperature and neutralized by addition 1 mL of 1 M K2PO4 and mixed for 2 min by vortex. Ethylacetate (5 mL) and n-hexane (3 mL) was added and mixed for 15 min by vortex and centrifuged at 4000 g for 15 min. The organic phase (6 mL) was collected into a 15 mL graduated glass tubes. The organic fraction was evaporated to dryness under a stream of nitrogen in a water bath at 42°C.
The dry residue was reconstituted with n-hexane (2 mL) and mixed for 2 min by vortex and methanol/water (5/95) (0.7 mL) was added and mixed for 2 min by vortex. 0.5 mL samples were taken from the lower phase with the help of syringe or automatic pipette and filtered using a 0.2 µm syringe filter into an autosampler vial.
Instrumentation
Chromatographic analyses were performed on a LC-MS/MS equipment consisted of a Thermo Electron TSQ Quantum Access Max, mass spectrometer controlled by the Xcalibur (2.2 SP1) software.
Chromatographic separations were achieved on Phenomenex Synergy Hydro RP (150x2.00 mm 80Å 4 µm), protected with a C18 guard column. The mobile phase was deionised water/methanol (80/20) (A) and methanol acidified with 0.1% acetic acid. The linear gradient was: 0-2 min 100% A, 2-9 min 10% A and 9-15 min 100% A and flow rate of 0.25 mL/min. Injection volume was 50 µL. The column was thermostated at 40°C. The analysis of samples were carried in the positive ESI-MS-MS ion mode.
Mass spectrometry
MS/MS parameters and precursor-product ions of each compound were tuned by direct infusion in the SRM mode and 0.25 mL/min flow rate of the mobile phase A and B) (50:50).
The concentration and content of mix standards derivatizes and internal standards used for control of the MS-detector, were 25 μg kg-1 for 2-NP-SEM-C13N15-N15 and 2-NP-(C13)3-AHD and other standards at 10 μg kg-1.
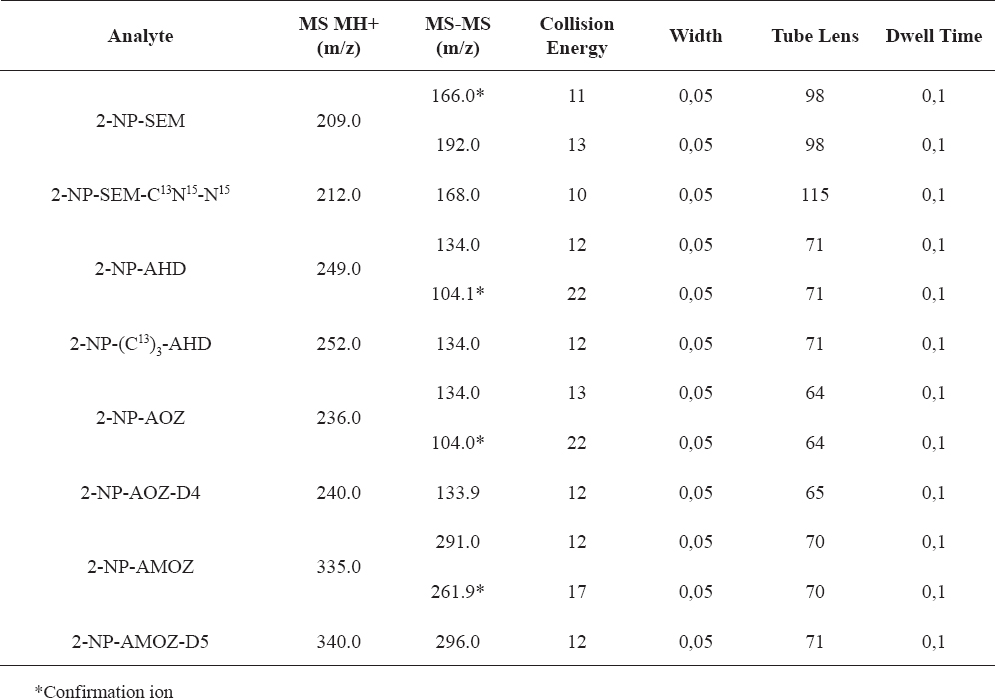
MS/MS detector parameters are given in Table 1. The precursor-product ions of each compound and their collision energy are given in Table 2.
Table 1. MS detector parameters
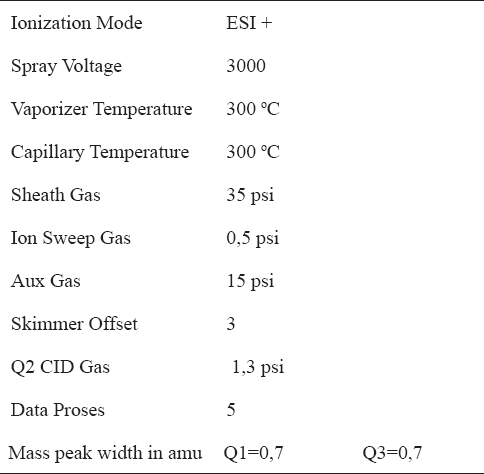
Table 2. LC–MS/MS confirmation parameters for the analytes
RESULTS
Specificity/Selectivity
Specificity/selectivity were evaluated via analysis of blank matrix samples fortified with mixed benzimidazole and nitroimidazole standards (concentration of 1 µg kg-1 each) and with standards of nitrofuran metabolites. According to analysis no significant peaks with an S/N (signal to noise) ratios of 3 or more and chromatographic interference were being observed at the retention times of the targeted nitrofuran metabolites.
Linearity
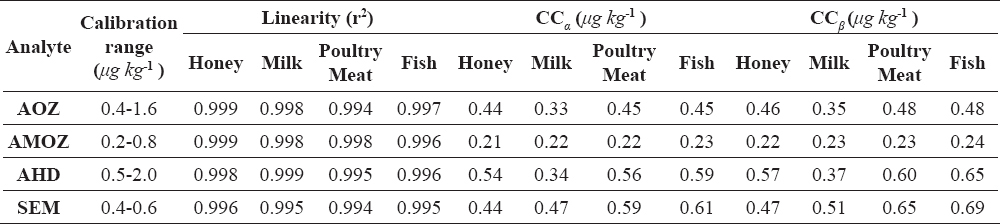
The matrix calibration curves were at four levels: 0.4, 0.8, 1.2 and 1.6 μg kg-1 for AOZ, AMOZ, AHD and SEM, which is in accordance with the MRPL levels. For each compound we made three matrix calibration curves, using blank samples, over three days with 6 replicates at four concentration levels. No significant differences were found between the different matrix curves (r2>0.9941) shown in Table 3.
Table 3. Summary of Linearity, CCα, and CCβ
Decision limit (CCα) and detection capability (CCβ)
The CCα and CCβ for banned substances were calculated with the application of the following formula;
CCα = C1 + 2.33 x SDwIR
where in C1 is lowest concentration level of the validation study (MRPL) and SDwIR is the standard deviation from within-laboratory reproducibility.
CCβ = CCα + 1.64 x SDwIR, CCα
where in SDwIR, CCα is standard deviation at CCα concentration.
For each compound of CCα and CCβ were calculated from the linearity study. The mean value CCα and CCβ were presented in Table 3.
Recovery
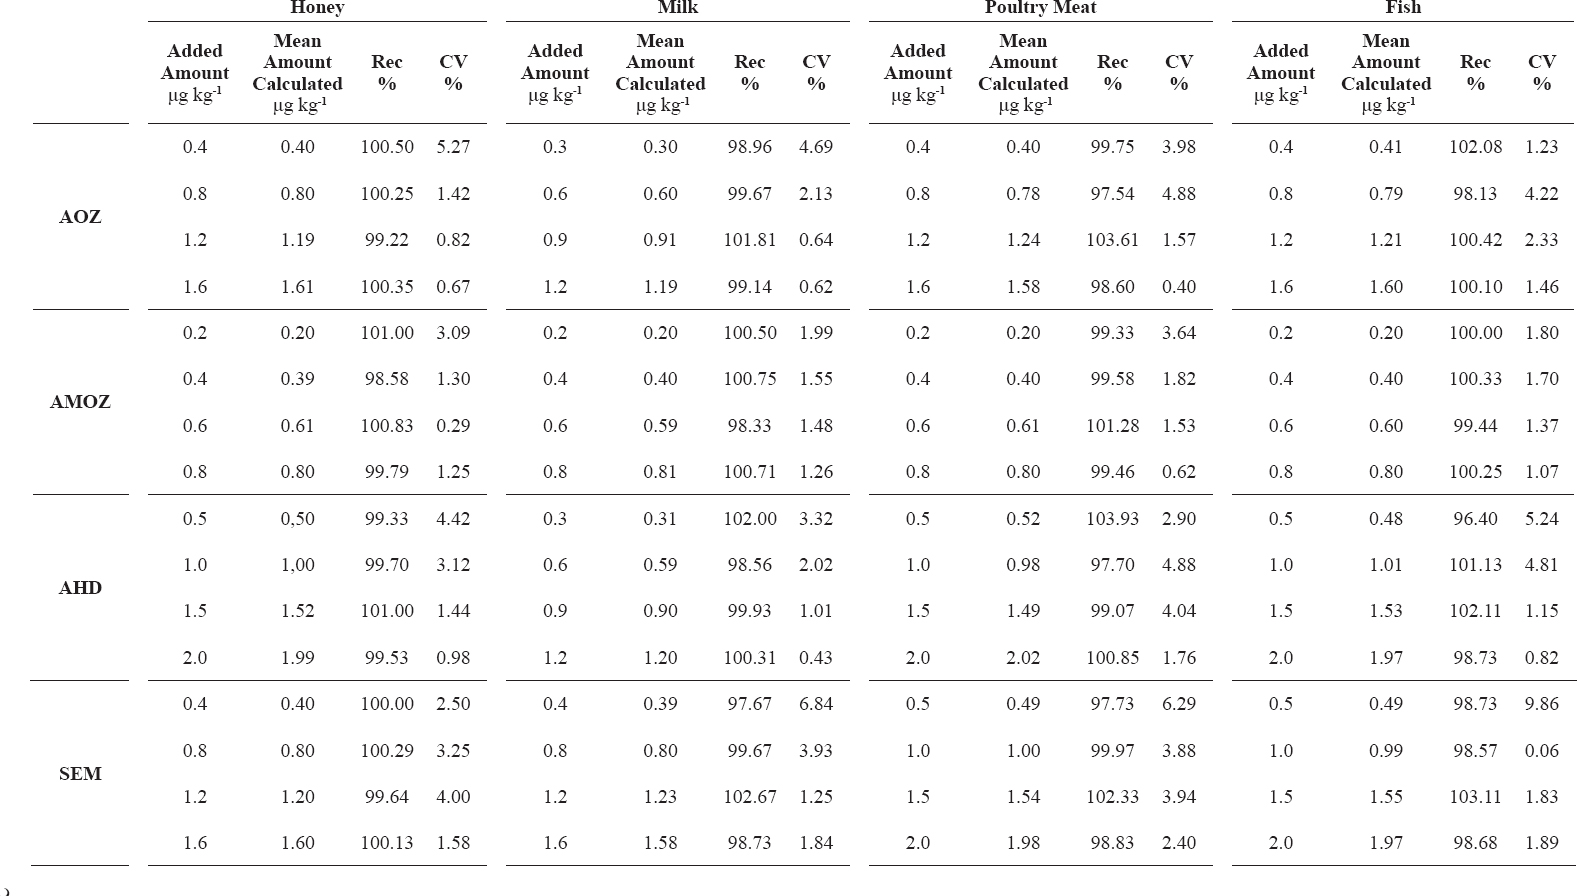
The method recoveries and RSDs were determined from 6 replicates at four concentration levels spiking blank samples over three days. The recovery results were observed in acceptable range of 70-110%. All the data relating to method recovery and precision were summarisedin Table 4; mean recoveries ranging and CV% values were satisfactory, required by Decision 2002/657/EC.
Table 4. Recovery of nitrofuran metabolites: between-day repeat measures
Evaluation
In order to evaluate this method, it eventually participating in the Food Analysis Performance Assessment Scheme (FAPAS), the test of “Nitrofuran Metabolites in Prawns” (FAPAS 02229, 12/05/2014, Lab No:75). AOZ total assigned value were 0.934 μg kg-1, the results of our laboratory 0.8 μg kg-1. Z-score were -0.7. The result is good and satisfactory.
DISCUSSION
To measure nitrofuran metabolites using the selective reaction-monitoring (SRM) mode, full scan and product ion spectra of the analytes were investigated under the LC conditions described in mass Spectrometry section. Nitrofuran metabolites could be detected under positive ionization mode ESI-MS conditions. Figure 1, 2, 3 and 4 show LC/MS/MS extracted-ion chromatograms obtained from analysis of a spiked samples.
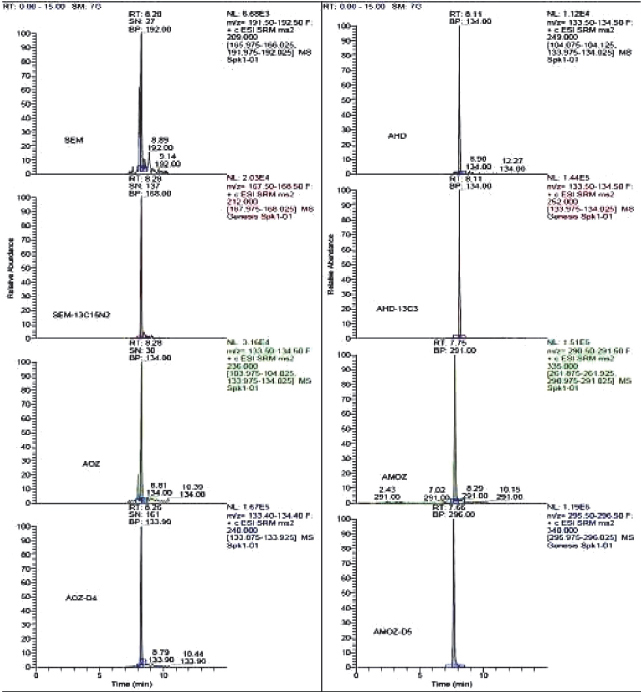
Figure 1. Chromatograms of blank milk samples fortified at 0.2 μg kg-1 for AMOZ, 0.3 μg kg-1 for AOZ and AHD, 0.4 μg kg-1 for SEM
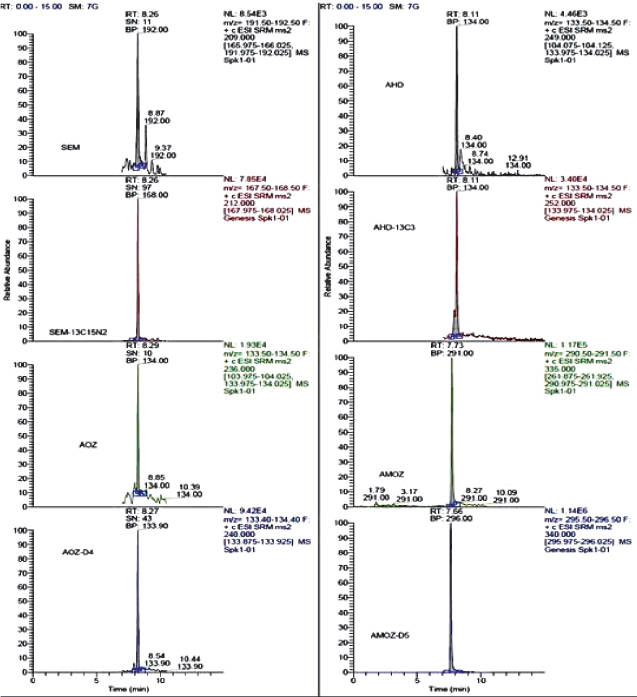
Figure 2. Chromatograms of blank honey samples fortified at 0.2 μg kg-1 for AMOZ, 0.4 μg kg-1 for AOZ and SEM, 0.5 μg kg-1 for AHD
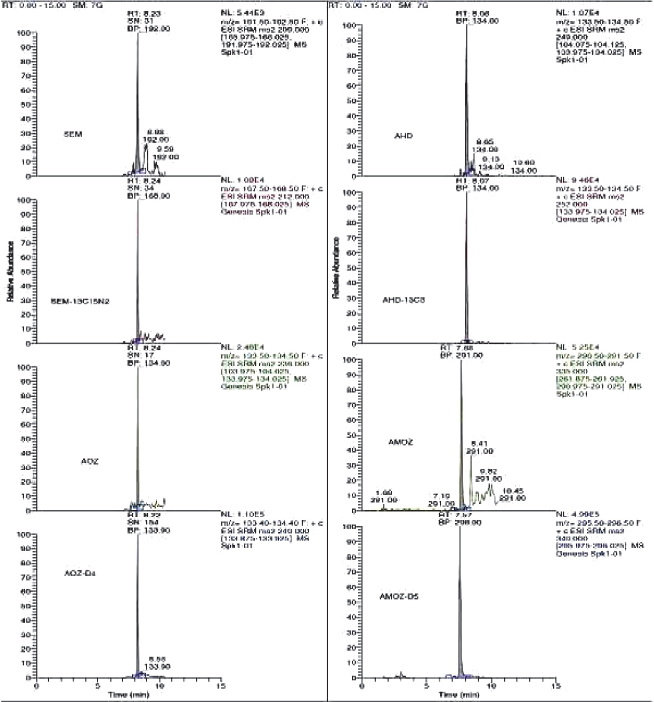
Figure 3. Chromatograms of blank poultry meat samples fortified at 0.2 μg kg-1 for AMOZ, 0.4 μg kg-1 for AOZ, 0.5 μg kg-1 for SEM and AHD
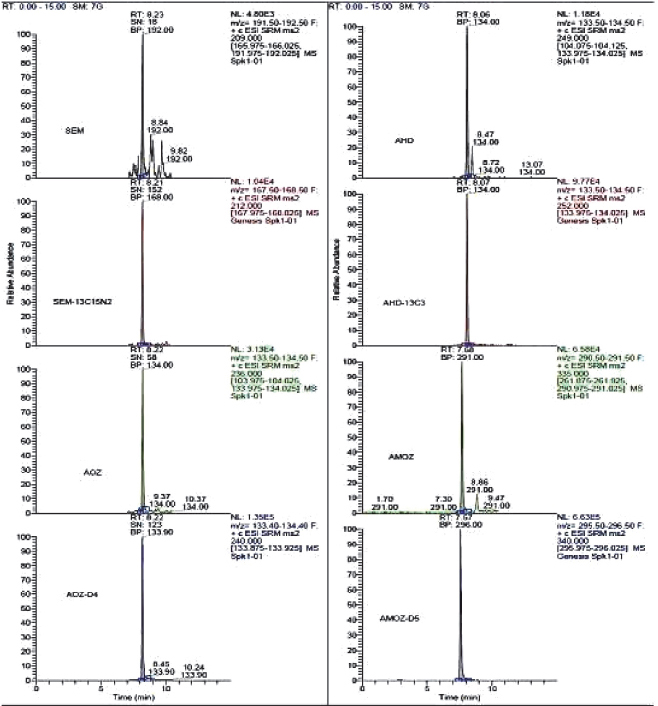
Figure 4. Chromatograms of blank fish samples fortified at 0.2 μg kg-1 for AMOZ, 0.4 μg kg-1 for AOZ, 0.5 μg kg-1 for SEM and AHD
This method has been developed and in-house validated in four different matrices (milk, honey, poultry meat and fish) according to the European Commission Decision 2002/657/EC requirements (13). Also, all four matrices have been accredited according to ISO 17025 by TURKAK (Agency of Accreditation in Turkey).
The majority of the method for nitrofuran metabolites in food then employ a solid phase extraction (SPE) step in order clean-up. Barbosa et al. (7), determinated of nitrofurans in animal feeds by liquid chromatography-UV photodiode array detection and liquid chromatography-ionspray tandem mass spectrometry. Following ethyl acetate extraction at mild alkaline conditions and purification on NH2 column (SPE), the nitrofurans are determined using liquid chromatography with photodiode-array detection (LC-DAD).
Mottier et al. (11) quantitative determinated of four nitrofuran metabolites in meat by isotope dilution liquid chromatography–electrospray ionisation–tandem mass spectrometry. This study, was used a method liquid–liquid extraction and clean-up on a polymeric solid phase extraction cartridge (SPE) are then performed before LC–MS/MS analysis by positive electrospray ionisation (ESI).
Consequently this LC–ESI–MS–MS method allows the simultaneous determination of nitrofuran metabolites in four matrix. The method avoids the use of clean-up by SPE and could be performed quickly. The obtained validation results indicate the accordance of the method with Decision 2002/657/EC (13). The repeatability and within-laboratory reproducibility (precision) of the method are less than 9.86 % for all analytes. The CCα and CCβ are below the MRPL of 1 μg kg-1. This method has been used for confirmatory analysis of nitrofuran metabolites in honey, milk, poultry meat and fish sample.
CONCLUSION
A rapid and sensitive method described in this paper provides reliable, simultaneous quantitative analysis for nitrofuran metabolites residues in milk, honey, poultry meat and fish samples. The optimized procedure provides significant advantages including simplicity, low operation cost, avoids the use of clean-up by SPE.
Thus should be performed quickly confirmative analysis for nitrofuran metabolites residues in milk, honey, poultry meat and fish samples and used as a routine analysis.