Mac Vet Rev 2016; 39 (1): 65 - 76
 10.1515/macvetrev-2015-0069
Received: 31 August 2015
Received in revised form: 23 November 2015
Accepted: 30 November 2015
Available Online First: 04 December 2015
Published on: 15 March 2016
Keywords: medicinal products, trimethoprim, UV/Vis spectrophotometry, validation
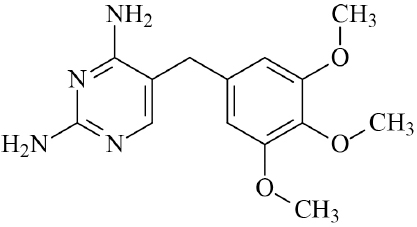
Trimethoprim (2,4-diamino-5-(3’4’5’-trimethoxy benzyl)pyrimidine) (Scheme 1) is a well known biological agent, employed as a potent metabolic inhibitor of bacterial dihydrofolic acid reductase (1). This drug is exhibiting high antibacterial activity against strains resistant to other antibiotics frequently used, e.g. β-lactams. The therapeutic activity of trimethoprim could be attributed to the pyrimidine ring system (see Scheme 1), also present in other biologically active substances such as nucleic acids, several vitamins, and coenzymes (2). The introduction of combination of trimethoprim (TMP) and sulfamethoxazole (SMX) in the middle of the 1970s resulted in increased use of sulfonamides for treatment of specific microbial infections (3). Due to their synergistic activity, sulfonamides potentiated with trimethoprim are one of the most widely used antimicrobial compounds against gram-negative and gram-positive bacteria.
Scheme 1. Structural formula of trimethoprim
The optimal combination of the two agents for their synergistic activity was found to be 5:1 (4). Pharmacologically, this ratio is optimal for satisfactory reduction of both the toxicity of the individual agents and possible resistance of the organism to them, thus enhancing the therapeutic effect.
The mixture of sulfonamides and TMP in pharmaceutical preparations was studied in a number of investigations and the latter provide several analytical methods for the determination thereof. Such methods include different analytical techniques mostly ultraviolet and visible (UV-Vis) spectrophotometry (3, 5-8), derivative spectrophotometry (9-11), high performance liquid chromatography (HPLC) (12-14) and chemometric methods applying multivariate calibrations (7). Other more rarely reported methods for TMP determination are titrimetric (16), voltametric (17), polarographic (18). Even though the Official pharmacopeia method includes HPLC determination (19), still, there are numerous UV-Vis methods proven as satisfactory alternative to the liquid chromatography (3, 8, 10, 11, 15). The main advantage thereof is their simplicity, rapidity, and low cost-effectiveness.
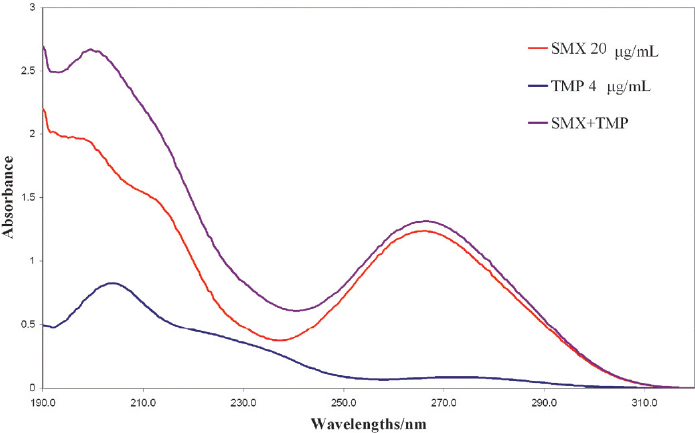
The UV absorption spectra of SMX and TMP show overlapping with each other (Fig. 1), creating a serious problem for their analysis in the pharmaceutical products. Therefore, various sample preparation techniques for the simultaneous determination of SMX and TMP in pharmaceuticals have been developed. The first order UV-Vis spectrophotometric methods to determinate TMP, in pure form and pharmaceutical formulations, are based on direct (7, 9, 10) and colorimetric spectrophotometry (5, 8, 15). Regarding the colorimetric spectrophotometry, the first publication (5), describes application of several reagents as π-acceptors for obtaining adduct products: bromothymol blue, bromocresol green, and alizarin red S. As extraction solvents the authors have proposed chloroform, methylene chloride and chlorobenzene. Adekoge et al. (8) have developed a method for spectrophotometric determination of TMP following charge-transfer complexation with chloranilic acid. The published study by Al-Sabha et al. (15), describes spectrophotometric determination of TMP based on the reaction of the amine group with 2,4-dinitro-1-fluorobenzene (DNFB) reagent in acetone medium. The main advance of these colorimetric methods is the significant difference in the absorption maxima of the compounds obtained, in comparison to the neat compounds, towards higher wavelengths in the visible spectra.
Figure 1. UV spectra of SMX (20 µg mL-1), TMP (4 µg mL-1) and SMX+TMP
In this work, we have focused on optimization and validation of two colorimetric spectrophotometric methods with bromocresol green (BCG) and DNFB, for determination of TMP in pharmaceutical products intended for use in human and veterinary medicine. In terms of improving the method performances and applicability, we have introduced some modifications in both methods such as different extraction solvents, experimental conditions and extended method ranges. With such modifications performed, we tested the methods reliability in terms of sensitivity, accuracy, and precision. Over more, we tested the methods applicability on real samples i.e. different formulations, different sulfonamides present in two formulation forms – tablets and powder. So far, there is insufficient literature data regarding method validation for TMP according to the internationally accepted criteria (20), when applied on formulations intended for use in veterinary medicine. The validation parameters obtained from the method applicability studies were analyzed for significance using suitable statistical tests.
The solutions were sonificated in VWR Ultrasonic cleaner (HF40 kHz, 60 W). The UV spectra of the blanks, standard and sample solutions, were recorded on a Varian Carry 50 UV/Visible Spectrophotometer, at room temperature in 1 cm quartz cell. The wavelength range was from 190 to 800 nm, with resolution 0.5 nm and scan rate of 300 nm/min. For spectral data acquisition and processing Varian Cary WinUV 2002 Software (Varian, Mulgrave, Victoria, Australia), was used.
Bromocresol green (Kemika, Zagreb, Croatia) was dissolved in 10 % N,N-dimethylacetamide (Sigma-Aldrich, St Louis, USA) in methanol, at concentration of 0.001 mol/L, and DFNB (Sigma-Aldrich, St Louis, USA) was dissolved in methanol at concentration of 0.01 mol/L. Methanol HPLC grade and acetone with purity ≥99.5 % used were supplied from Sigma-Aldrich (St Louis, USA). For pH adjustment, a NaOH solution with concentration of 0.1 mol/L was applied. The analytical standard of TMP (Vetranal) purchased from Fluka (St. Gallen, Switzerland), was used for preparation of stock solution containing 1.00 mg/mL in HPLC grade methanol (Sigma-Aldrich, Bellafonte, USA). From this stock applying suitable dilutions, for the BCG method, we prepared a series of calibration standards with concentrations of 1, 5, 10, 15, 20, 25, 30 and 35 µg/mL. The series of calibration standards for the DNFB method were prepared in the range 20, 30, 40, 50, 60, 70, 80, and 90 µg/mL.
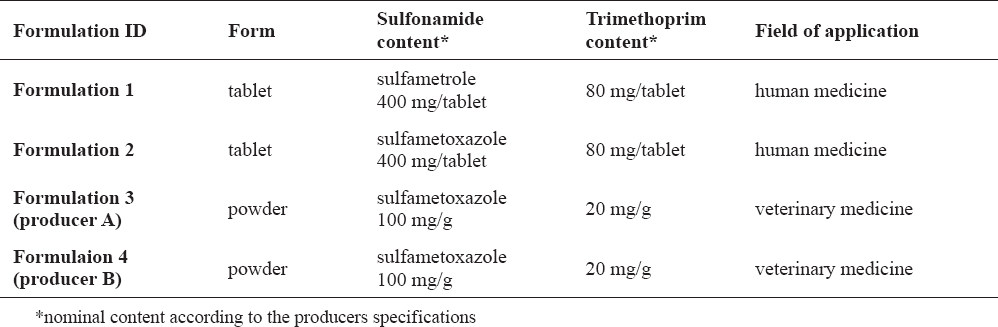
The method validation and applicability was tested on four different medicinal products containing sulfonamides and TMP. The detailed description of each formulation is presented in Table 1.
Table 1. Content of sulfonamides and trimethoprim in medicinal products
The previously published BCG method (5) was modified and optimized towards obtaining the best linearity and recovery. For this purpose, first, different solvents were tested in different media: methanol, ethanol, 10 % N,N-dimethylacetamide in methanol, obtaining the best achievable method performances. The next step was the optimization of the sonification time; therefore, the samples were treated for 30, 45, and 60 minutes in the ultrasonic bath.
The DNFB assay was performed on the basis of the previously published method by Al-Sabha and Hamody (15). Thus, some modifications were necessary towards the optimal heating temperature and time, as well as use of different filtration means. By monitoring the linearity and trueness performances, we chose the most appropriate experimental conditions.
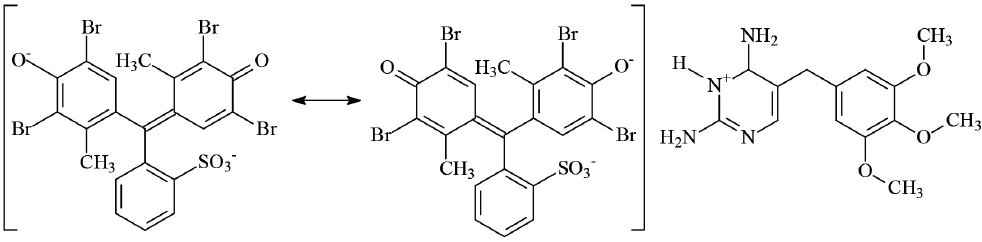
Adequate mass portions of the tested formulations (0.0356 g, 0.0312 g, 0.250 g and 0.250 g, for Formulation 1, 2, 3 and 4, respectively) were transferred in 50 mL volumetric flasks and filled up to 2/3 with 10 % solution of N,N-dimethylacetamide in methanol. The solutions were sonificated at room temperature for 30 and 45 minutes for human and veterinary formulations, respectively. In the next step they were filled up with 10 % solution of N,N-dimethylacetamide in methanol to a volume of 50 mL. Afterwards they were filtered through quantitative filter (ashless, grade 41, by Whatman). A suitable aliquot of the initial solutions (equal to TMP concentration of ~100 μg/mL) was taken obtaining a TMP concentration of 20 μg/mL in 10 mL volumetric flasks. In the following step, 1 mL of the BCG solution was added, and the pH value of the media was adjusted with 20-25 µL of the 0.1 M NaOH solution to a value of approximately 7.5. Finally, the samples were filled up to volume with 10% N,N-dimethylacetamide. Before performing the spectrophotometric measurement, the samples were filtered through 0.45 µm syringe filters. The suitably prepared series of standards were processed as described for the samples. The standard and sample solutions prepared are with green color and exhibit absorption maxima around 620 nm, as a result of the TMP-BCG adduct formed (Scheme 2). The absorbance was measured against reagent blank prepared following the same procedure.
Scheme 2. TMP-BCG adduct
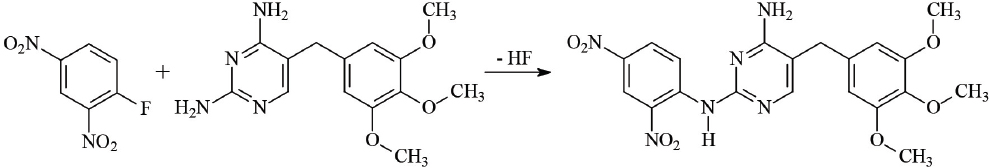
For DNFB method, the measured mass portions of the formulations (0.0536 g, 0.0469 g, 0.375 g and 0.375 g for for Formulation 1, 2, 3 and 4, respectively) were transferred in 25 mL volumetric flask and filled up to 2/3 with in acetone. We sonicated the samples for 30 min, filled up with acetone to the final volume, and consequently filtered them through quantitative filter (ashless, grade 41, by Whatman) and 0.45 µm syringe filters. Afterwards, suitable aliquots of the initial solution with concentration of ~300 µg/mL of TMP was taken obtaining a TMP concentration of 60 μg/mL in 10 mL volumetric flasks. Two mililiters of DNFB reagent were added and the solution was heated for 40 min at 50 °C and additionally for 10 min at 60 °C. The heating time and temperature were somewhat modified in comparison to the previously published method (15), thus avoiding acetone evaporation. After cooling the samples to room temperature, we filled them up with acetone and measured on the spectrophotometer, against similarly prepared regent blank. The series of standards for the DNFB method mentioned above were processed following the same procedure. The product of reaction of nucleophilic substitution of TMP with DNFB (Scheme 3) is with pale red color and exhibit absorption maxima around 540 nm.
Scheme 3. Reaction of nucleophilic substitution of TMP with DNFB
The validation for both methods applied for TMP determination in investigated formulations was conducted according to the ICH requirements (20). The methods were tested for linearity, limit of detection (LOD), limit of quantification (LOQ), accuracy estimated through recovery experiments, and precision. LOD and LOQ were estimated through the standard errors of the calibration curves (21). For recovery assessment for BCG method each formulation was spiked with TMP standard of 10 µg mL-1 in triplicates, equal to final concentration of 30 µg mL-1. Precision for BCG method was estimated performing six individually measured replicates for each formulation at level of 20 µg mL-1. Regarding the DNFB method, the solution formulations containing 60 µg mL-1 were spiked with TMP solution containing 30 µg mL-1 of the analyte. Precision assessment was performed on six replicates in two different days for each formulation. The adjusted TMP concentration was 20 and 60 µg mL-1, for the BCG and DNFB method, respectively.
The statistical analysis of the validation data obtained was performed using Microsoft Office Excel 2003. The recovery and precision data obtained for investigated formulations were tested applying t-test and F-test for significance, at a confidence level of 95 % (P < 0.05).
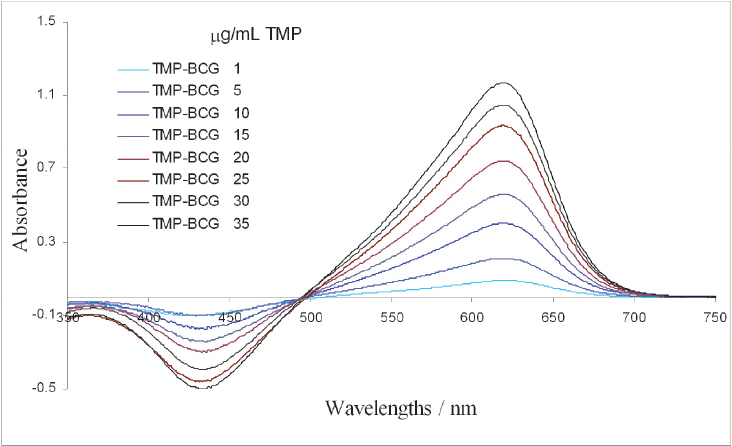
For the BCG method, the linearity observed was within the range 1–35 µg mL-1, from eight calibration points measured in five replicates. Calibration curve was determined from the signals of the absorbances maxima at 618 nm (Fig. 2).
Figure 2. UV/Vis spectra of standard solutions of trimethoprim (1–35 µg mL-1) obtained with BCG method
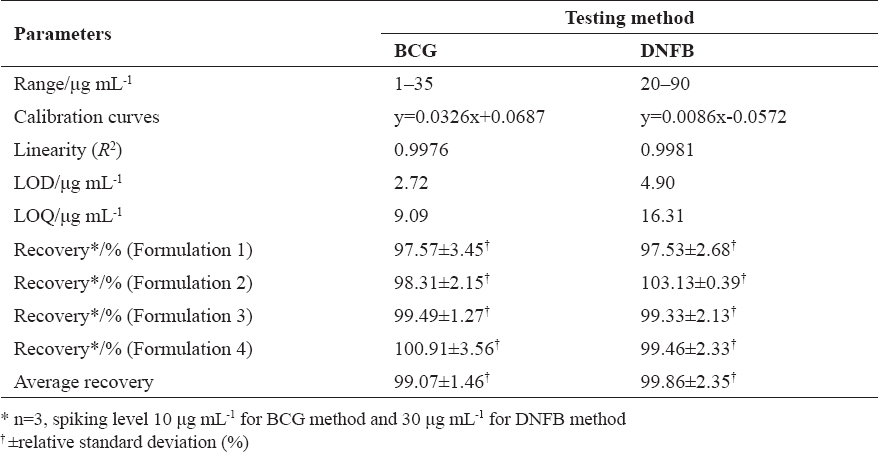
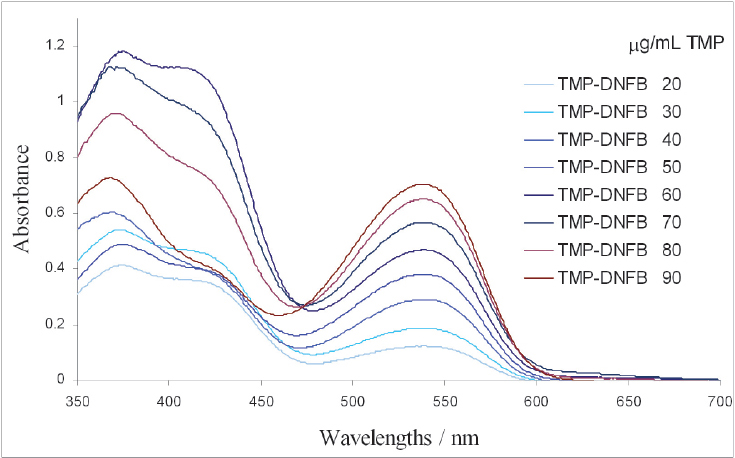
Negative absorbance values in spectra occur due to the higher presence of BCG in the blank in comparison to the solutions where TMP is present. By increasing the TMP concentration, the amount of BCG decreases due to adduct formed. The correlation coefficient value (R2) was 0.9976 (Table 2). For the DNFB method, the linearity was determined in the range 20–90 µg mL-1, with R2 of 0.9981 (Table 2), on the basis of the signals measured at 538 nm from eight calibration points in five replicates (Fig. 3).
Table 2. Linearity, sensitivity and accuracy of BCG and DNFB method
Figure 3. UV/Vis spectra of standard solutions of trimethoprim (20–90 µg mL-1) obtained with DNFB method
Even though the method sensitivity is not a crucial parameter when analytes in sufficiently high concentrations are analyzed, yet, we wanted to determine the LODs and LOQs for the modified methods. These parameters are estimated through the standard deviation of the calibration curve slope (21). The obtained sensitivity parameters for the BCG method are within the method range, while for the DNFB method they were estimated to be below the lowest calibration standard (Table 2).
To test the method suitability in term of accuracy, recovery experiments were conducted by adding 10 μg mL-1 of TMP standard solution to the different formulation sample extracts containing the analyte at level of 20 μg mL-1 and 60 μg mL-1 for the BCG and DNFB method, respectively. Afterwards, the samples were analyzed by the optimized BCG and DNFB methods. The results from the recovery testing for investigated formulations for both methods were within the range 97.57–100.56 %, and 97.53–103.13 %, respectively (Table 2). On Fig. 4 and Fig. 5 examples of spectra of samples with TMP spiked with standard solutions with concentrations mentioned above are presented.
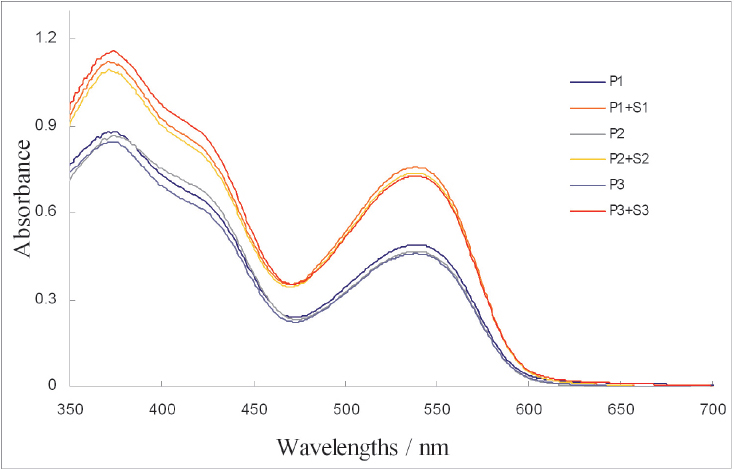
Figure 4. UV/Vis spectra of spiking experiments for recovery for BCG method (sample of Formulation 2 containing 20 µg mL-1 TMP + 10 µg mL-1 of standard solution TMP)
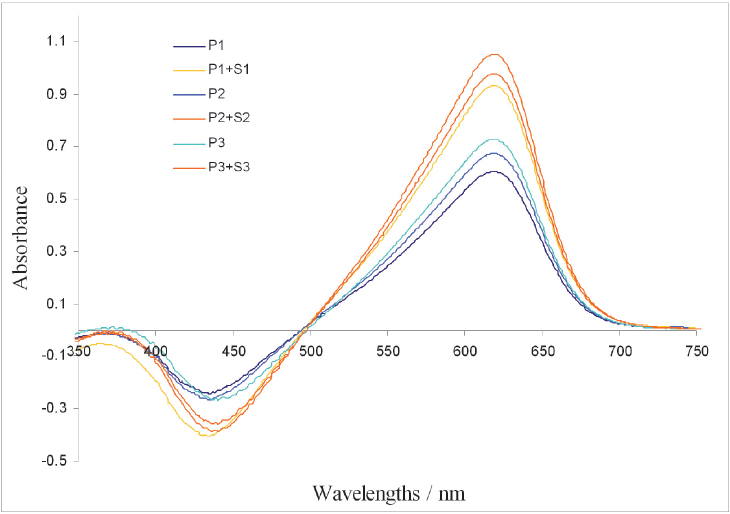
Figure 5. UV/Vis spectra of spiking experiments for recovery for DNFB method (sample of Formulation 2 containing 60 µg mL-1 TMP + 30 µg mL-1 of standard solution TMP)
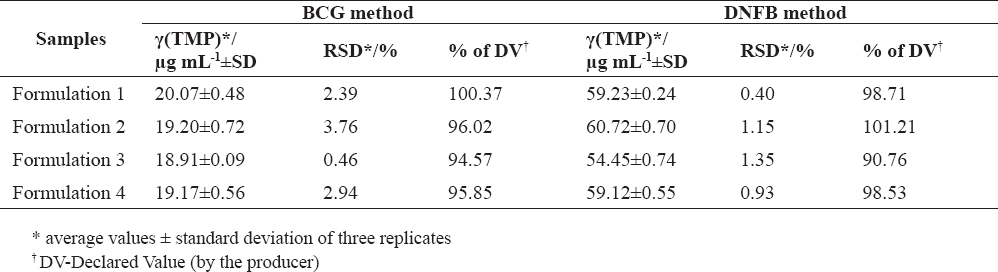
The precision of the BCG and DNFB method was determined for all formulations tested on two different days, estimating the intra - and inter-day variations. The results from the precision experiments are presented in Tables 3 and 4. The within-day precision for the BCG method for investigated formulations ranged between 0.46 and 3.76 %. Regarding the DNFB method, in average, we obtained higher precision, with estimated values between 0.40 and 1.35 %.
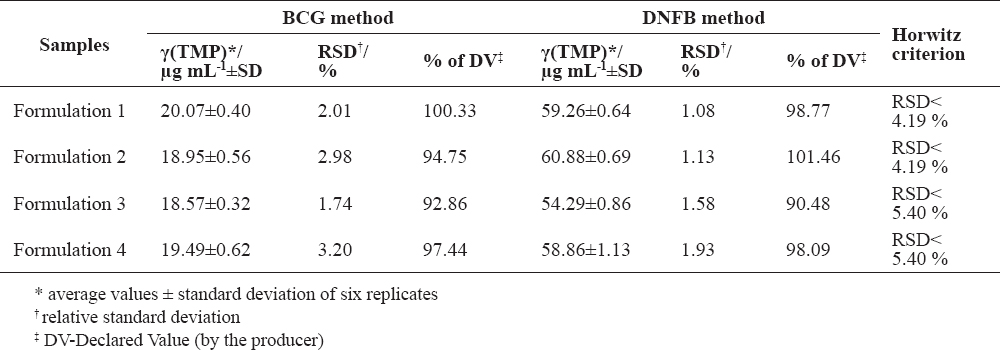
The between-day precision for the BCG method was estimated to be in the range 1.74 to 3.20 %; while for the DNFB method, it was between 1.08 and 1.93 % (Table 4).
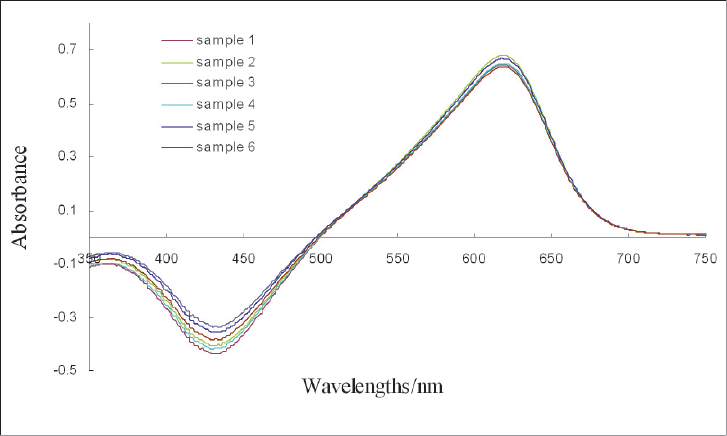
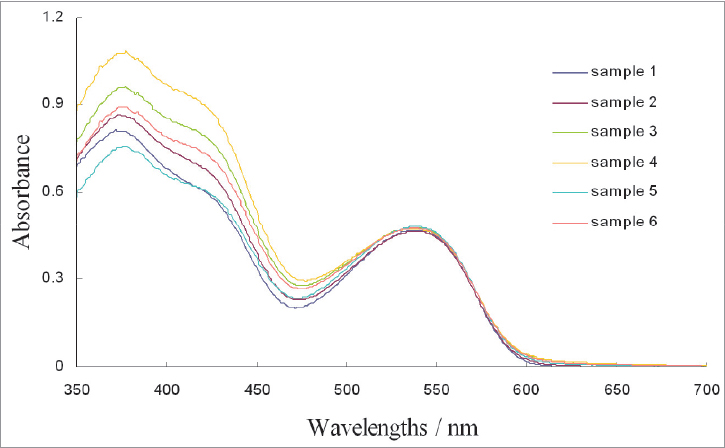
Figs. 6 and 7 are examples of the overlapped spectra, from six measurements with the BCG and DNFB method, respectively obtained for Formulation 2.
Figure 6. UV/Vis spectra from precision experiments for BCG method (Sample of Formulation 2 containing 20 µg mL-1)
Figure 7. UV/Vis spectra from precision experiments for DNFB method (Sample of Formulation 2 containing 60 µg mL-1)
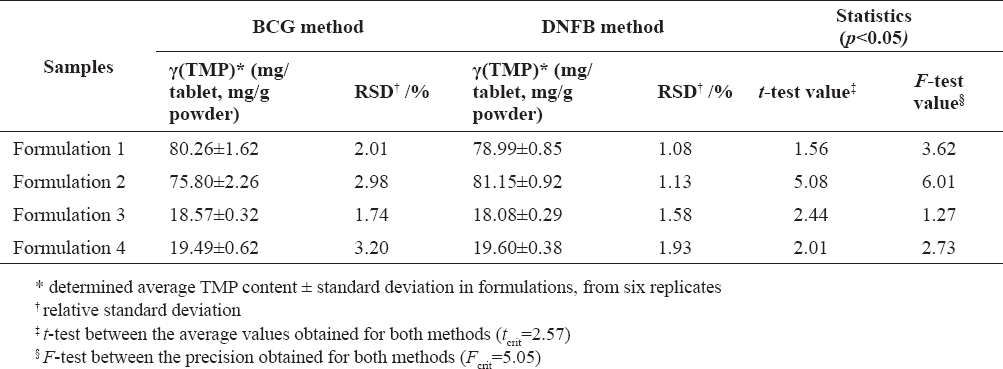
To compare the BCG and DNFB method performances, in terms of closeness of the determined TMP content in investigated formulations and precision, we performed t-test and F-test, respectively. The obtained statistical values for significance are presented in Table 5. According to the data obtained, significant difference was observed when both methods were applied on Formulation 2. For other formulations tested, the statistical tests revealed that both methods are equally precise and accurate.
The application of ultraviolet (UV) spectroscopy for determination of TMP in presence of some sulfonamide has often proved difficult due to the overlapping of their UV absorption spectra. Charge transfer complexation reactions have been widely applied in quality control of important chemical compounds of pharmaceutical interest in human and veterinary medicine, as well (5, 8, 15). For the methods we proposed, there were insufficient validation or applicability data on various real formulation forms (5, 15).
It is based on the reaction where BCG is most probably acting as an acceptor of the π electrons from TMP (5). The optimal experimental conditions were chosen determining the recovery values of TMP at different conditions. Regarding the sonification time, the experiments reveled that for human formulations 30 min duration enables satisfactory recovery of TMP, while for veterinary formulations the optimal time was 45 min. During the optimization if was noticed that the reaction of TMP with BCG is more completed in basic media. Therefore, 20-25 μL of 0.1 mol/L NaOH solution was added for adjustment of the pH value of the media. Unlike our experiments, in the previously published report by El-Ansary (5), the influence of pH value on adduct formation was not taken into consideration; i.e. no pH adjustment was performed. As a first choice of solvents for TMP extraction from formulations were pure methanol and ethanol, considered as more environment friendly reagents. The recovery value of 106.49 % and 117.61 %, for methanol and ethanol, respectively, indicated that some of interfering substances are co-extracted, thus increasing the UV-Vis signal of the samples. By modifying the methanol with 10 % solution of N,N-dimethylacetamide, we obtained recovery values between 95 and 105 % (Table 2) which is acceptable according to the ICH requirements (20). This was due to the fact that TMP is more soluble in N,N-dimethylacetamide (22) unlike pure ethanol and methanol. Second reason is that adding of N,N-dimethylacetamide increases the alkalinity of the solvent (methanol), which is necessary for the TMP extraction, especially in the presence of sulfonamides, for which the extraction is favorable in acidic environment. However, the use of pure N,N-dimethylacetamide is neither ecologically nor economically justified. Thus, by methanol modification adding 10% N,N-dimethylacetamide the conditions for better extraction of TMP are obtained in terms of obtaining better solubility of TMP in weakly basic environment, and is also ecologically and economically acceptable. Accordingly, in comparison to the previously published method for TMP determination with BCG (5), our method was improved in terms of excluding the use of environment non-friendly organic solvents such as chloroform, methylene chloride and chlorobenzene. The obtained spectra from TMP calibration solutions measured in wavelength range 350–750 nm, and concentration range 1–35 μg mL-1 (Fig. 2), confirmed that this solvent system was the best choice for carrying out further experiments.
This method for determination of TMP applying UV-Vis spectroscopy is based on nucleophylic substitution on the free primary amino group in the TMP molecule (15). The rosy red colored complex formed exhibits two absorption bands at around 380 nm, and between 500 and 600 nm. The first one is a doublet of two overlapped peaks, while the second one is well-shaped symmetrical band (Fig. 3). Therefore, the choice of acetone as extraction solvent was logical because it absorbs at wavelengths lower than 300 nm. The heating of the solution is a crucial factor for completing the substitution reaction, i.e. complex formation. According to the previously published DNFB method (15), the solutions should be heated at 60°C for 40 minutes. Applying this temperature, after approximately 20 min we observed total acetone evaporation. Therefore, in our further experiments we heated the solutions at 50 °C for 45 min, obtaining solutions with pale pink color. By further heating at 60 °C for 10 min the solutions color became more intensive, resulting in well-defined absorption peak around 540 nm (Fig. 3). Al-Sabha and Hamody (15) concluded that the optimal pH value for complex formation is 7.4. Accordingly, we did not make any pH adjustment of the media before performing the substitution reaction.
The range for both methods was selected on the basis of TMP content in the formulations. Additionally, we had to have in mind the fact that for fulfilling the Lambert-Beers law the UV-Vis signal of the maximal concentration should be around one absorbance unit. On this basis, we decided that the linear dynamic range is going to be 1–35 µg mL-1 and 20–90 µg mL-1 for BCG and DNFB method, respectively (Table 2). Regarding the BCG method, the linearity was obtained measuring the signals from five repetitive measurements of each standard, at 618 nm. Thus, the method revealed good linearity (R2=0.9976) for the range mentioned above. In comparison to the previously published method for BCG (5), where the linearity was determined within the range 2.9–20.3 µg mL-1, we expanded the linearity range on our modified method. Applying the DNFB method within the range defined, the regression coefficient obtained was 0.9981; calculated from the absorbances at 538 nm, from five repetitive measurements for each standard concentration. The previously published method for DNFB (15) demonstrated the linearity within the range 10–75 µg mL-1. For both methods we proposed, the linearity obtained was better than 0.99, fulfilling the requirements from the reference document (20). Even though the method sensitivity for determination of analytes that are present in the samples in sufficiently high amounts is not a critical parameter, yet we have determined the LOD and LOQ values. The BCG and DNFB method sensitivity parameters calculated from the calibration curve standard deviation (21), revealed values (Table 2) comparable to ones obtained by other authors (8). Thus, Adegoke et al. (8) obtained values of 2.69 and 8.96 µg mL-1 for LOD and LOQ, respectively. On the other hand when applying the derivative spectrophotometric method for TMP determination, Zimmer et al. (10), estimated the LOD value to be 0.11 µg mL-1.
Comparing the recovery results for both methods one may conclude that they are equally accurate, except for Formulation 2 where the DNFB method revealed significantly higher recovery rate. This could be attributed to interferences due to greater acetone extractability for some of the unknown formulation excipients. The values obtained for the recoveries are in the range 97.57–100.91 % and 97.53–103.13 % for the BCG and DNFB method, respectively. The recovery values obtained indicate that the methods are fulfilling the method accuracy acceptable limits (95–105 %) according to the reference document requirements (20). Therefore, one may conclude that the modified and optimized methods are sufficiently accurate for performing quality control of medicinal products, regarding TMP determination. In reference to the BCG method, the previously published study (5) has not reported validation data regarding the recovery estimation. However, the recovery values obtained for the DNFB method within this study are comparable with those obtained applying colorimetric UV-Vis spectroscopic methods. Thus, Al-Sabha and Hamody (15) have obtained recovery values within the range 100.43±1.07 %. Recently, Adegoke et al. (8) have reported spectophotometric determination of TMP following charge-transfer complexation with chloranilic acid, whereas the recovery estimated was form 99.97 to 102.57 %. In another investigation, Shamsa and Amani (3) have proposed a diazotization procedure for TMP spectrophotometric determination in the visible spectra. The recovery values they have obtained are somewhat higher (104–105.5%) when compared with the results obtained within our study. In general, our proposed methods are satisfactorily accurate regarding the reference document (20) and comparable to ones reported by other authors.
The precision of the BCG and DNFB method was determined for all formulations tested on two different days, estimating the intra- and inter-day variations (Table 3). Within-day precision for the BCG method determined from three repetitive measurements were estimated to be from 0.46 (Formulation 3) to 3.76 % (Formulation 2). Regarding the DNFB method, the precision ranged from 0.40 % (Formulation 1) to 1.35 % (Formulation 3). The between-day accuracy of the BCG method, in terms of relative standard deviation (Table 4) ranged from 1.74 % (Formulation 3) to 3.20 % (Formulation 4). For the DNFB method, we obtained between-day precision values ranged from 1.08 (Formulation 1) to 1.93 % (Formulation 4). In general, the DNFB method pronounced higher precision with standard error variations between 1 and 2 %. All between-day precision data estimated (Table 4) are in accordance with Horwitz criteria for maximal acceptable precision, calculated from the proposed formula, based on analyte content in analyzed samples (23). The precision values obtained for the DNFB method are very similar to ones determined with the same method by Al-Sabha et al. (15), being in average around 1 %. In comparison, the precision values obtained for other complexation methods for TMP determination were within the range 1.3–1.7 % (8), and 1.3–2.2 % (3). However, applying spectrophotometric method with metol and potassium hexacyanoferrate(III), Ayad et al. (24) revealed significantly lower precision data for TMP, ranged from 0.274–0.748 %.
Table 3. Within-day precision for BCG and DNFB method
Table 4. Between-day precision for BCG and DNFB method
Previously, by evaluating the recovery and relative standard deviation, we have presented the study on method linearity, sensitivity, accuracy, and precision (Tables 2, 3, and 4). The method applicability was tested through determination of TMP in four investigated formulations, and the corresponding results for both methods were tested for significance (Table 5). Statistical analysis was performed using F-ratio test and Student’s t-test (P<0.05). The statistical analysis results indicated that regarding the formulation 1, 3 and 4 (Table 1), there was no difference in the accuracy and precision between both methods applied. The difference was observed for Formulation 2, whereas BCG and DNFB method exhibited significantly different average content of TMP in the formulation, as well as significantly different precision (Table 5). The TMP content on Formulation 1 and Formulation 2 is equal (80 mg/tablet); however such difference was not observed for Formulation 1. We assume that it could be a result of the probable interference of the unknown matrix from the tablet on the TMP– BCG reaction.
Table 5. Statistical evaluation of the performances of BCG and DNFB method
Clearly recognized advantages of the optimized and validated methods for determination of TMP are simplicity, high precision, and high accuracy. When compared to the previously reported BCG and DNFB methods, our study has made improvements towards enlarging of the method ranges, as well as avoiding of environmental non-friendly toxic solvents. Future investigations could be focused on interferences study using placebo as blank for the recovery and precision experiments.
Improvement and validation of two visible spectrophotometric methods applying BCG and DNFB as reagents for TMP determination in investigated formulations were successfully carried out. The near 100 % recoveries and low relative standard deviation values obtained, point to the suitability of the both modified and validated methods for determination of TMP in various potentiated sulfonamide formulations intended for use in human and veterinary medicine. This study could contribute towards improvement of the quality control of TMP in potentiated sulfonamides intended for use in veterinary medicine, applying simple, effective, precise and low cost testing methods.
1. Fresta, M., Furneri, P.M., Mezzasalma, E., Nicolosi, V.M., Pugeisi, G. (1996). Correlation of trimethoprim and brodimoprim physicochemical and lipid membrane interaction properties with their accumulation in human neutrophils, Antimicrob. Agents Chemother. 40(12): 2865 - 2873. PMid:9124856 PMCid:PMC163637
2. Saha, N., Kar, S.K., (1977). Metal complexes of pyrimidine-derived ligands - I: Nickel (II) complexes of 2-hydrazino-4,6-dimethyl pyrimidine, J. Inorg. Nucl. Chem. 39, 195-200. http://dx.doi.org/10.1016/0022-1902(77)80465-X
3. Shamsa, F., Amani, L. (2006). Determination of sulfamethoxazole and trimethoprim in pharmaceuticals by visible and UV spectrometry, Iran. J. Pharm. Res. 1, 31-36.
4. Reisberg, B., Herzog, J., Weinstein, L. (1967). In vitro antibacterial activity of trimethoprim alone and in combination with sulfonamides. Antimicrob. Agents Chemother., 424-426.
5. El-Ansary, A.L., Issa, Y.M., Selim, W. (1999). Spectrophotometric determination of trimethoprim in pure form and in pharmaceutical preparations using Bromthymol blue, Bromocresol green and Alizarin red S. Anal. Lett. 32(5): 655-969. http://dx.doi.org/10.1080/00032719908542869
6. Gemperline, P.J., Cho, J. H., Baker, B., Batchelor, B., Walker, D.S. (1997). Determination of multicomponent dissolution profiles of pharmaceutical products by in situ fiber-optic UV measurements. Anal. Chim. Acta. 345, 155-159. http://dx.doi.org/10.1016/S0003-2670(97)00095-0
7. Ni, Y., Q. Zj., Kokot, S. (2006). Simultaneous ultraviolet-spectrophotometric determination of sulfonamides by multivariate calibration approaches. Chemometr. Intell. Lab. 82, 241-247. http://dx.doi.org/10.1016/j.chemolab.2005.07.006
8. Adekoge, O.A., Babalola, C.P., Kotila, O.A., Obuebhor, O. (2014). Simultaneous spectrophotometric determination of trimethoprim and sulphamethoxazole following charge-transfer complexation with chloranilic acid. Arabian Journal of Chemistry, in press
9. Othman S. (1989). Multicomponent derivative spectroscopic analysis of sulfamethoxazole and trimethoprim. Int. J. Pharm. 63, 173-176.
http://dx.doi.org/10.1016/0378-5173(90)90168-4
10. Zimmer, Ł., Czarnecki, W. (2010). Derivative spectrophotometric method for simultaneous determination of sulfadimidine and trimethoprim. Annales Universitatis Mariae Curie-Skłodowska, Lublin - Polonia, Sectio DDD, 23(1-3): 27-36.
11. Medina, J.R., Miranda, M., Hurtado, M., Dominguez-Ramirez, A. M., Ruiz-Segura, J.C. (2013). Simultaneous determination of trimethoprim and sulfamethoxazole in immediate-release oral dosage forms by first-order derivative spectroscopy: Application to dissolution studies. Int. J. Pharm. Pharm. Sci. 5 (Suppl.4), 505-510.
12. Rezaee, A., Nejad, Q.B., Kebriaeezadeh, A. (2000). Simultaneous analysis of thrimethoprim and sulphamethoxazole drug combinations in dosage forms by High Performance Liquid Chromatography. Iran. Biomed. J. 4 (2&3): 75-78.
13. Akay, C., Özkan, S.A. (2002). Simultaneous LC determination of thrimethoprim and sulfamethoxazole in pharmaceutical formulations. J. Pharm. Biomed. Anal. 30, 1207-1213. http://dx.doi.org/10.1016/S0731-7085(02)00460-0
14. Lemus Gallego, J.M., Perez Arroyo, J. (2002). Simultaneous determination of dexamethazone and trimethoprim by liquid chromatography. J. Pharm. Biomed. Anal. 30, 1255-1261. http://dx.doi.org/10.1016/S0731-7085(02)00468-5
15. Al-Sabha, T.N., Hamody, I.A. (2011). Spectrophotometric determination of trimethoprim using 2,4-dinitro-1-fluorobenzene reagent. J. Edu. & Sci. 24(2): 1-12.
16. Chati, S., Wadookar, S.G., Kasture, A.V. (1979). Nonaqueous titrimetric method for timethoprim determination in combination. Indian J. Pahrm. Sci. 41(6): 231.
17. Carapuca, H.M., Cabral, D.J., Rocha, L.S. (2005). Adsorptive stripping voltammetry of trimethoprim: mechanistic studies and application to the fast determination in pharmaceutical suspensions. J. Pharm. Biomed. Anal. 38(2): 364-369. http://dx.doi.org/10.1016/j.jpba.2005.01.005 PMid:15925233
18. Chatten, L.G., Stanley-Pons, B., McLeod, P. (1982). Electrochemical determination of trimethoprim. Analyst 107, 1026-103. http://dx.doi.org/10.1039/an9820701026 PMid:7149266
19. British Pharmacopoeia 2009, Volume I & II, p. 6201-6207.
20. ICH Harmonized tripartite guideline. Validation of analytical procedures: Text and methodology. Q2 (R1). (2005). International conference on harmonization of technical requirements for registration of pharmaceuticals for human use.
21. Miler, J.C., Miler, J.N. (1994). Statistics for analytical chemistry. 3rd Edition, Ellis Horwood Ltd. Chichester, West Sussex PMid:7819605
22. Profiles of drug substances, excipients and related methodology. In: Klaus Florey (Ed.), Analytical profiles of drug substances. Volume 7. (pp. 459). 1978, San Diego, California: Academic Press, USA.
23. Horwitz, W. (1982). Evaluation of analytical methods used for regulation of foods and drugs, Anal. Chem. 54 (1): 67A-76A. http://dx.doi.org/10.1021/ac00238a765
24. Ayad, M.R.R., Huda, M.A., Halah H. (2012). Spectrophotometric determination of trimethoprim in pure form and pharmaceutical formulations with metol and potassium hexacyanoferrate (III). Tikrit Journal of Pharmaceutical Sciences 8(2): 209-220.
© 2015 Stojković G. This is an open-access article published under the terms of the Creative Commons Attribution License which permits unrestricted use, distribution, and reproduction in any medium, provided the original author and source are credited.
The authors declared that they have no potential conflict of interest with respect to the authorship and/or publication of this article.
Macedonian Veterinary Review. Volume 39, Issue 1, Pages 65-76, p-ISSN 1409-7621, e-ISSN 1857-7415, DOI: 10.1515/macvetrev-2015-0069, 2016