A cross-sectional survey was conducted in Kosovo to determine the presence and prevalence of bovine leukemia virus antibodies in cattle. A total of 5,051 serum samples from 315 villages were collected during 2016. Samples were tested using commercial indirect enzyme-linked immunosorbent assay. At least one sero-positive animal was found in 55 (17.5%) of the villages sampled, of which 23 had more than one sero-positive detected. Overall individual sero-prevalence, corrected for geographic distribution of samples, was found to be 2.26% (95% c.i. 1.62% to 3.04%). There were no statistically significant associations between serological status and herd size or age of animal, although sero-prevalence in 5-year-old cattle was higher than in the other ages. There was a statistical significant heterogeneity in sero-prevalence between different geographic zones of Kosovo (chi‐square value = 20.68 (4 d.f.); (p=0.0004). Pairwise comparisons showed that sero‐prevalence in the south was significantly higher than in the east and in the north and sero‐prevalence in the west was significantly higher than in the north. The 3.11% aggregated sero-prevalence for the two highest sero-prevalence zones, south and west, was significantly higher than the 1.57% aggregated sero-prevalence for the remaining zones, centre, east and north (Fisher exact p‐value (2‐tail) = 0.0004). The reason for higher prevalence in the south and west of Kosovo is uncertain. These results may serve to enrich the information of bovine leukemia virus distribution in the region, as well as a starting point for the future control and eradication strategy in Kosovo.
Enzootic bovine leukosis (EBL) is caused by bovine leukemia virus (BLV), an oncogenic retrovirus, member of the delta retrovirus genus. There are at least ten different BLV genotypes circulating in various geographical locations worldwide (
1). Most BLV transmission is horizontal and may be iatrogenic. Most common route of infection is through contact with infected blood. Any contaminated material with blood or rich in lymphocytes has the potential to infect animals, as it is the case in many common farm procedures such as tattooing, dehorning, rectal palpation, injections and blood sampling (
2). Insect vectors such as tabanids and other large biting flies also may transmit the virus. However, their role as vectors of BLV under a natural grazing system is still a matter for discussion (
3,
4).
Vertical transmission accounts for a relatively small proportion of infections. It may occur
in utero or during delivery. The presence of the viral antigens and the proviral DNA has been demonstrated in colostrum of infected animals. However, it is believed that presence of large number of maternal antibodies in colostrum have protective effects that outweigh the infectious potential when calves are fed with colostrum properly (
5,
6). After being infected, cattle develop a lifelong antibody response, which is primarily directed against gp51 envelope protein and p24 capsid protein. Most of the infected cattle remain asymptomatic. Around 30% of infected cattle develop persistent lymphocytosis and less than 5% develop lymphosarcoma with diverse clinical symptoms as the tumours invade different tissues (
7). Economic loss is due to the direct cost from culling animals that display lymphosarcoma and reduced productivity.
Association between BLV sero-prevalence and reduction in dairy herd productivity has been described (
8,
9,
10). No vaccines are available. Serology is the most common and reliable way to diagnose infection with BLV. Enzyme-linked immunosorbent assay (ELISA) is the most common diagnostic test in routine use (
11). Various ELISAs are commercially available and generally good agreement between assays is expected (
12). BLV is present in cattle worldwide. Today it is the subject of EU policies and international trade regulations. Eradication programs based on test and slaughter have been successful in the majority of western European countries, but the infection is still present in East and Southeast Europe (
1,
13). Before this survey there were no data on the presence or prevalence of BLV in Kosovo. Here we present the first countrywide survey of BLV in Kosovo. These results may serve to enrich the information of BLV distribution in the region, and as a starting point for the future control and eradication strategy in Kosovo.
MATERIAL AND METHODS
Survey design, sampling frame and sampling strategyThe survey was conducted using sera collected during a multi-purpose survey designed for detection of bluetongue sero-positivity in young cattle and at the same time to estimate individual prevalence of brucellosis in adult cattle. At the time of the survey it was not certain whether BLV was present in Kosovo, so the first purpose of the BLV survey was to detect evidence of the virus if it was present. A stochastic simulation of the sampling process was used to ensure that the sample size was sufficient to provide between 90% and 98% probability of detecting a BLV sero-positive animal if BLV was present in the cattle population of Kosovo at a minimum individual sero-prevalence of at least 0.1%. In the event that BLV was present, as turned out to be the case, the survey would allow estimation of sero-prevalence of around 0.6%, with precision of ± 0.4% and confidence of 95%.
The sampling frame was derived from the identification and registration (I&R) database. A list of 54,966 cattle-keeping premises in 1,500 villages was used. The total registered cattle population at the time was 356,500. The total area of Kosovo territory of about 11,000 km2 was divided into five geographic areas using municipality boundaries (North, Centre, East, South and West) of roughly equal area (i.e. about 2,250 km2 each) (
Fig. 1).
 Figure 1.
 Geographic areas of Kosovo
A multi-stage sampling strategy was used. Since cattle from the different premises in a village are frequently herded together at common grazing the village was treated as the epidemiological cluster. The villages were selected first, after a number of animals were to be sampled per village. Due to the tendency for infectious disease to cluster in villages the total sample size was calculated including a Design Effect of x4, using a method described by Bennett et al. (
14). The sampling design chosen to meet the specification was to sample 18 cattle (over 24 m. old) from each of 360 villages ( total n umber o f s amples = 6 ,480). The distribution of cattle-keeping villages between the five geographic areas is not even, with relatively more in the West and Centre areas. To reflect this in the sample more villages were selected from these two areas: 90 each from the Centre and the West, and 60 each from the other areas, bringing the total villages sampled to 360.
A practically implementable protocol was developed for randomly selecting cattle to be sampled in each village, which also guaranteed proportionate representation of cattle from different herd sizes in the overall sample. For each village selected, the field teams were given a randomly ordered list of premises that had at least three registered cattle. They were instructed to visit premises following the random order of the list and to sample all adult (over 2 years old) female cattle they found until they had obtained 18 samples in each village. This equates to random sampling of individual cattle in each village with probability proportional to the size of the herd, with the effect that more samples will be taken from bigger herds. This was to avoid over-representation of cattle from smaller herds in the sample. This was an important consideration because the 55% of premises with less than five cattle accounted for only 20% of the registered cattle population, while 49% of the cattle population were registered in a minority (16%) of premises with herd sizes of more than 10 cattle. This protocol provided that the full requirement of samples per village would be obtained in a random fashion even if the I&R database used to generate the lists was inaccurate.
SamplingBleeding of animals in the field was carried out by private veterinary practitioners who were subcontracted by a main contractor. Blood samples were collected between June and October 2016. The samples were obtained from adult (over 2 years old) female cattle using plain vacutainer tubes. All sampled animals were apparently healthy at the time of sampling. Each sample was given a unique ID separate from the animal’s ear tag number, which although recorded at the time of sampling was not to be linked with the sample during laboratory processing. The estimated age of sampled animals was also requested from the owner/keeper and recorded. Instructions were issued to make sure samples were kept cool in transit to the laboratory. The total number of eligible adult cattle samples for BLV testing was 5,051 from 315 villages (average just over 16 per village). This was slightly below the targeted requirement.
Laboratory diagnostic testingOn receipt the clot was removed from samples and the serum samples were stored at ‐20 ˚C. Serum samples were tested by using a commercial indirect ELISA (IDEXX Leukosis serum screening Ref: P02110‐5) which is standardised to detect the European standard serum for (E5) diluted to 1:100 in negative bovine serum, according to the requirements of the Council Directive 64/432/EEC (modified on December 11, 1984, June 26, 1991 and March 2001) (
15). Sera were tested individually by using short protocol according to the manufacturer’s instructions. Reading was performed at 450 nm in absorbance reader (Infinite pro 200 NanoQuant TECAN®). Samples with sp% ≥60 were classified positive and samples with sp% <60 were negative.
Statistical analysisAsymmetric Wilson score confidence intervals taking into account the sample size and the total population (sampling fraction) were calculated for prevalence estimates using the online statistical toolbox at
OpenEpi.com (
16). This method provides exact, non‐symmetrical confidence intervals for estimates based on simple random samples that are robust even when sample size is small and/or the prevalence is close to 0% or 100% (
17,
18,
19).
To take account of the two-stage survey design, in which samples were clustered by village, the method described by Bennett et al. (
14), using villages as the unit of sample clustering, was used to obtain an estimate of the ‘design effect’. The lower and upper bounds of the Wilson score confidence intervals were then inflated by the square root of the design effect. Finally, calculation of the overall sero-prevalence estimates also took account of the distribution of samples by geographic area (
Fig. 1). The proportions of the registered cattle population contained within each geographic area were used as weighting factors to adjust the overall prevalence estimate for Kosovo according to the relative population in each geographic area.
Sero-prevalences for different herd size categories and age groups (by year cohort) where information on estimated age was provided were calculated using Wilson score 95% c.i. as for simple random sample, without accounting for possible design effect. Differences in sero-prevalence between groups were assessed for statistical significance using the chi-square statistic where more than two groups were involved and the Fisher exact test for 2-way comparisons only.
The ‘detection sensitivity’ at village cluster level was estimated using equations provided in Cannon and Roe, 1982 (
20).
RESULTS
Individual prevalence estimatesIn total 5,051 adult cattle samples were tested for BLV antibody and 110 samples were positive, giving an overall individual sero-prevalence 2.18% with 95% c.i (1.53% to 2.95%). Although the number of samples obtained per village was not high enough to provide a high chance of detecting all infected villages, especially if the prevalence of infection was low, at least one sero-positive animal was found in 55 (17.5%) of villages sampled, of which 23 had more than one sero-positive detected.
Sero-prevalence by ageThe sero‐prevalences for different age groups (by year cohort), where information on estimated age was provided with the sample are shown in
Fig. 2, with Wilson score 95% c.i. calculated as for a simple random sample (no accounting for possible design effect). Individual BLV sero-prevalence in cattle 2 to < 3 year-old was 1.47% with 95% c.i (0.71% to 3.00%), 3 to < 4 year-old 1.66% (0.98% to 2.83%), 4 to < 5 year-old 2.11% (1.34% to 3.30%), 5 to < 6 year-old 3.50% (2.43% to 5.01%), 6 to < 7 year-old 2.14% (1.32% to 3.46%) and > 7 year-old was 2.10% (1.43% to 3.09%).
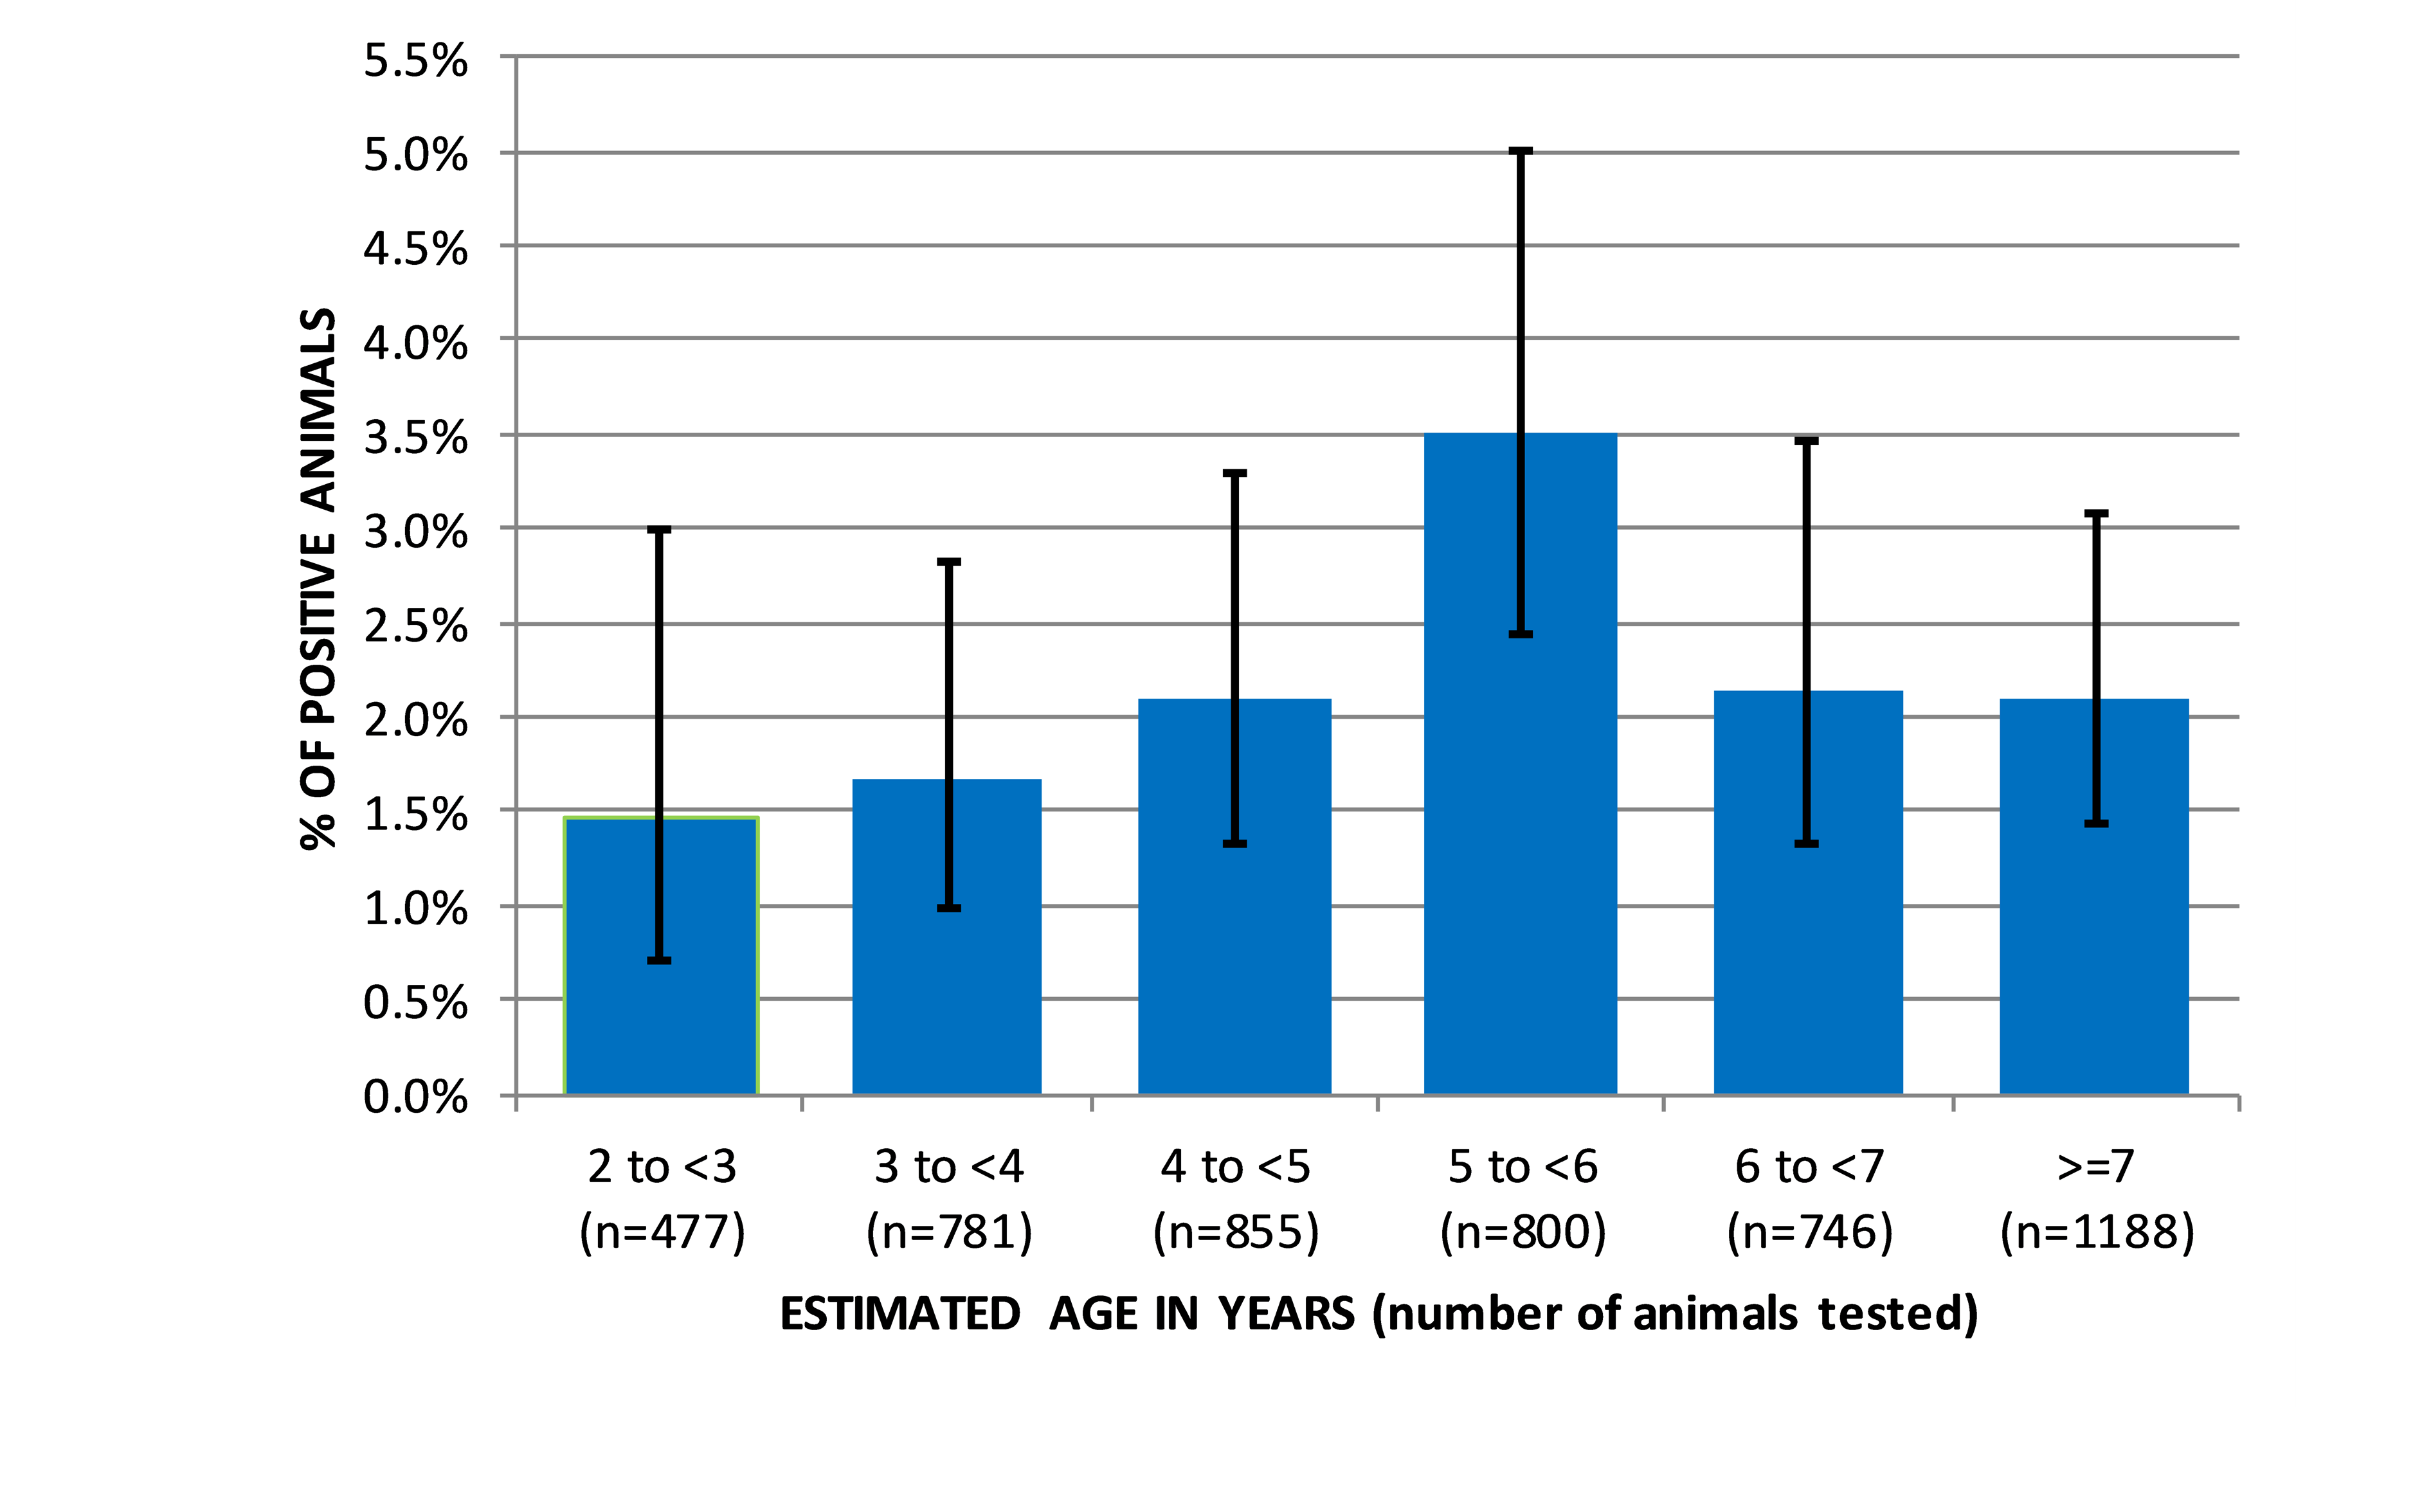 Figure 2.
 Bovine leukemia virus sero‐prevalence (ELISA) in adult cattle across Kosovo in 2016, by age. The error bars indicate the Wilson score 95% c.i. calculated as for a simple random sample
There were no statistically significant differences between the age groups (analysed excluding not specified): overall chi square 8.58 (5 d.f.) with p‐value =0.1270. The visual impression from
Fig. 2 is that prevalence in cattle 5 to < 6-year-old was higher than the sero‐prevalence of the younger and older age groups, although this difference did not reach the level of significance.
Sero-prevalence by herd sizeThe sero‐prevalences for different herd size categories are shown in
Table 1 with Wilson score 95% c.i. calculated as for a simple random sample (no accounting for possible design effect).
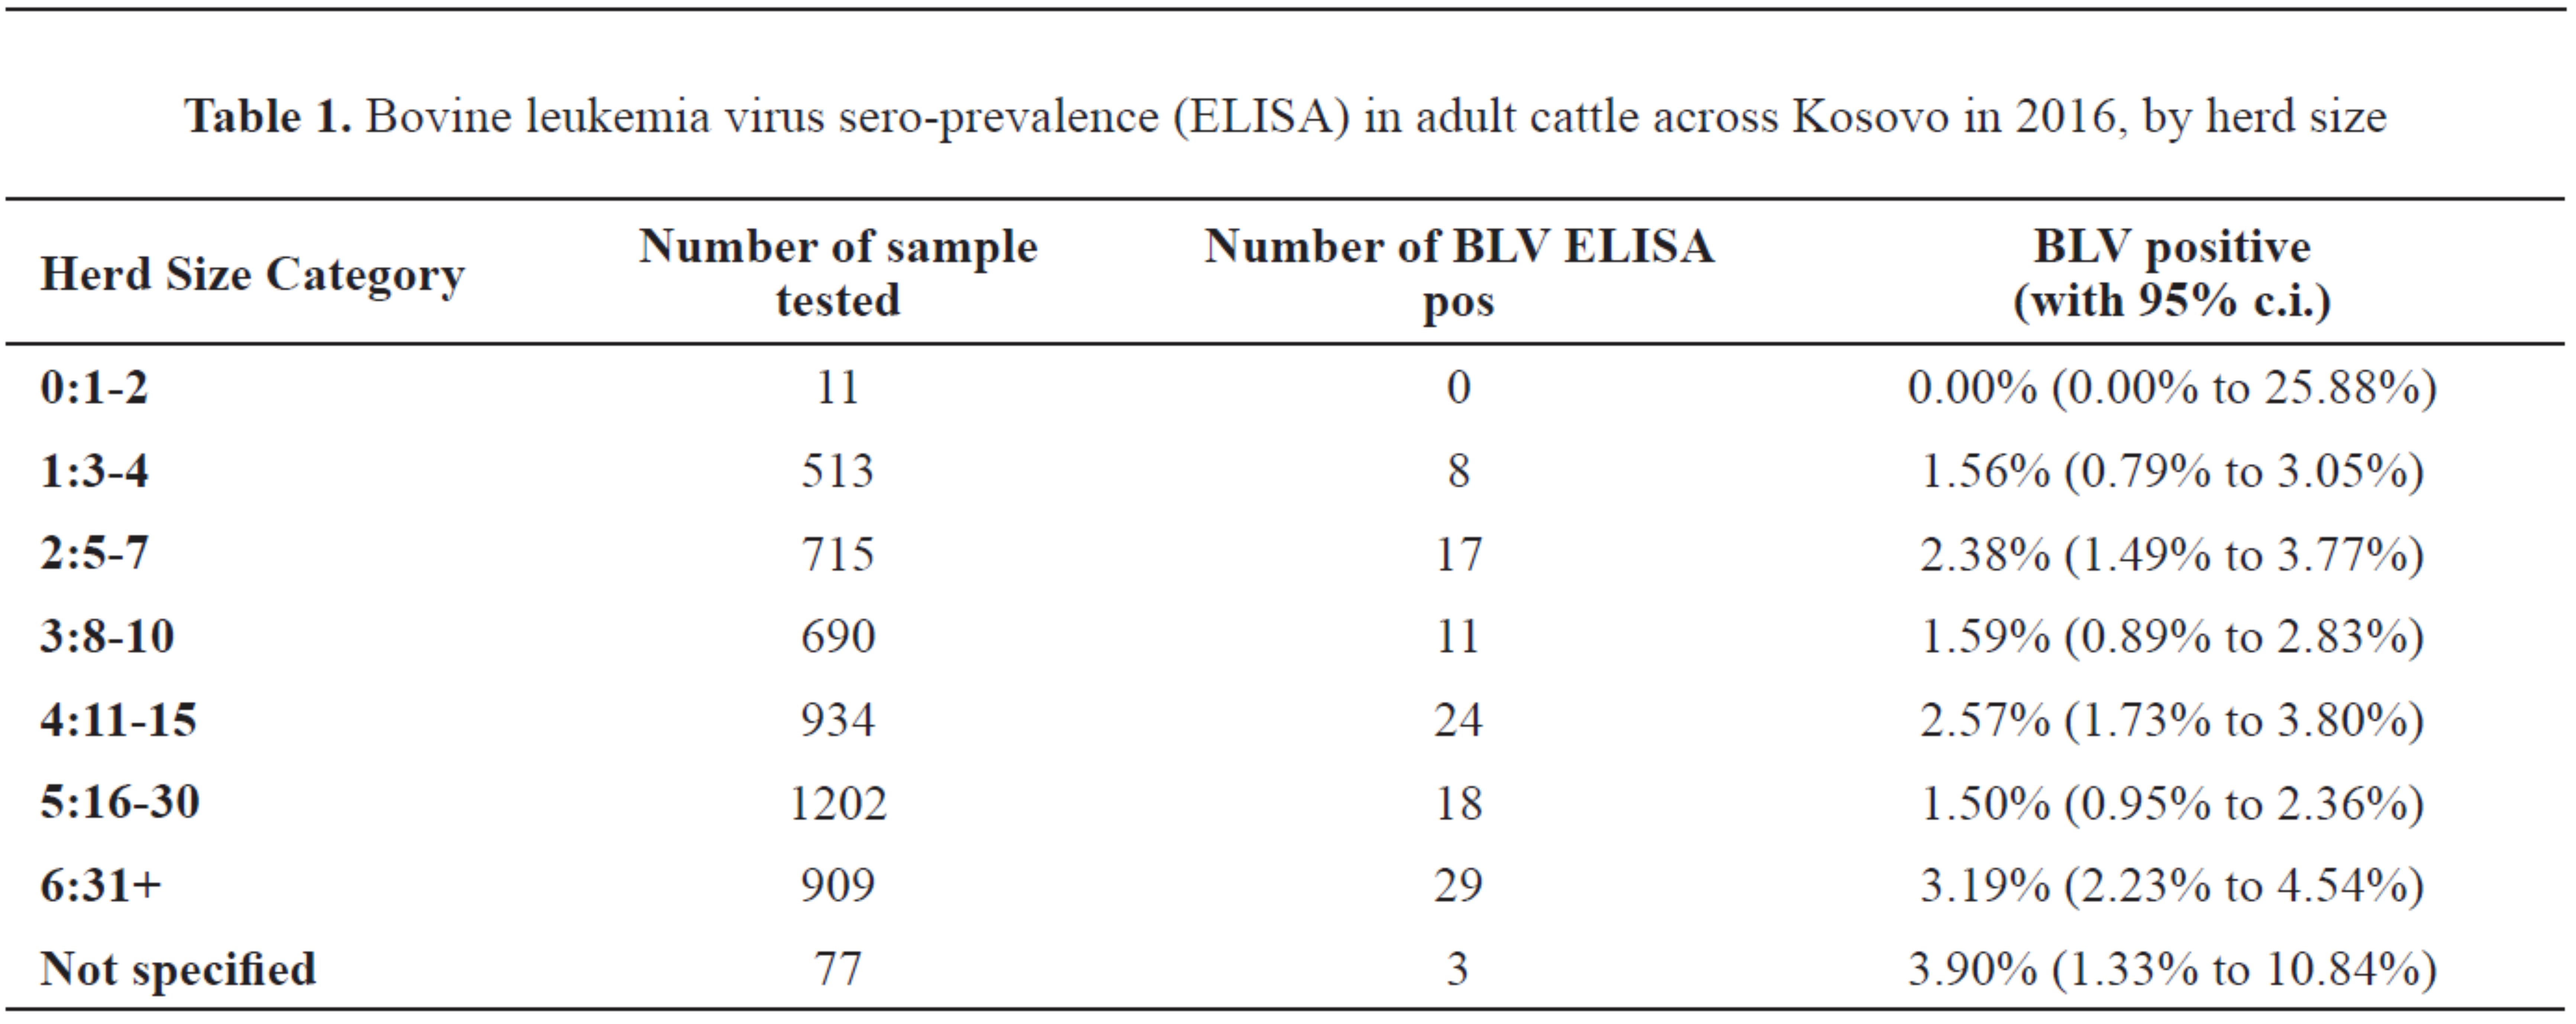
There were no statistically significant differences in BLV prevalence in cattle between herd sizes (analysed excluding not specified and the smallest herd size of 1‐2): overall chi‐square value = 9.902 (5d.f.), p=0.0781.
Sero-prevalence by geographic area
Fig. 3 shows the BLV sero-prevalence results stratified by geographic area. The lower and upper bounds of the Wilson score confidence intervals were inflated by a factor of the square root of the design effect to take account of the two‐stage sampling design. The proportions of the registered cattle population contained within each geographic area were used as weighting factors to adjust the overall prevalence estimate for Kosovo according to the relative population in each geographic area. This results in a point estimate and 95% confidence interval for the individual sero‐prevalence for BLV in adult cattle of: 2.26%, 95% c.i. 1.62% to 3.04%. Sero‐prevalence for BLV was highest in the south 3.72% (1.78% to 6.38%) and west geographic area 2.60% (1.45% to 4.25%), compared to north 0.84% (0.36% to 1.80%), east 1.56% (0.75% to 2.88%) and centre 2.17% (0.63% to 4.42%). There was statistically significant heterogeneity in BLV prevalence in cattle between geographic areas: overall chi‐square value = 20.68 (4d.f.), p=0.0004. Pairwise comparisons showed that BLV seroprevalence in the south was significantly higher than in the east and in the north. BLV sero‐prevalence in the west was significantly higher than in the north. If the results from the two highest prevalence areas are aggregated and compared with the remaining lower prevalence areas (also aggregated), the difference is statistically significant (Fisher exact p‐value (2‐tail) = 0.0004). South and west aggregated prevalence was 3.11%, whereas centre, east and north aggregated prevalence was 1.57%.
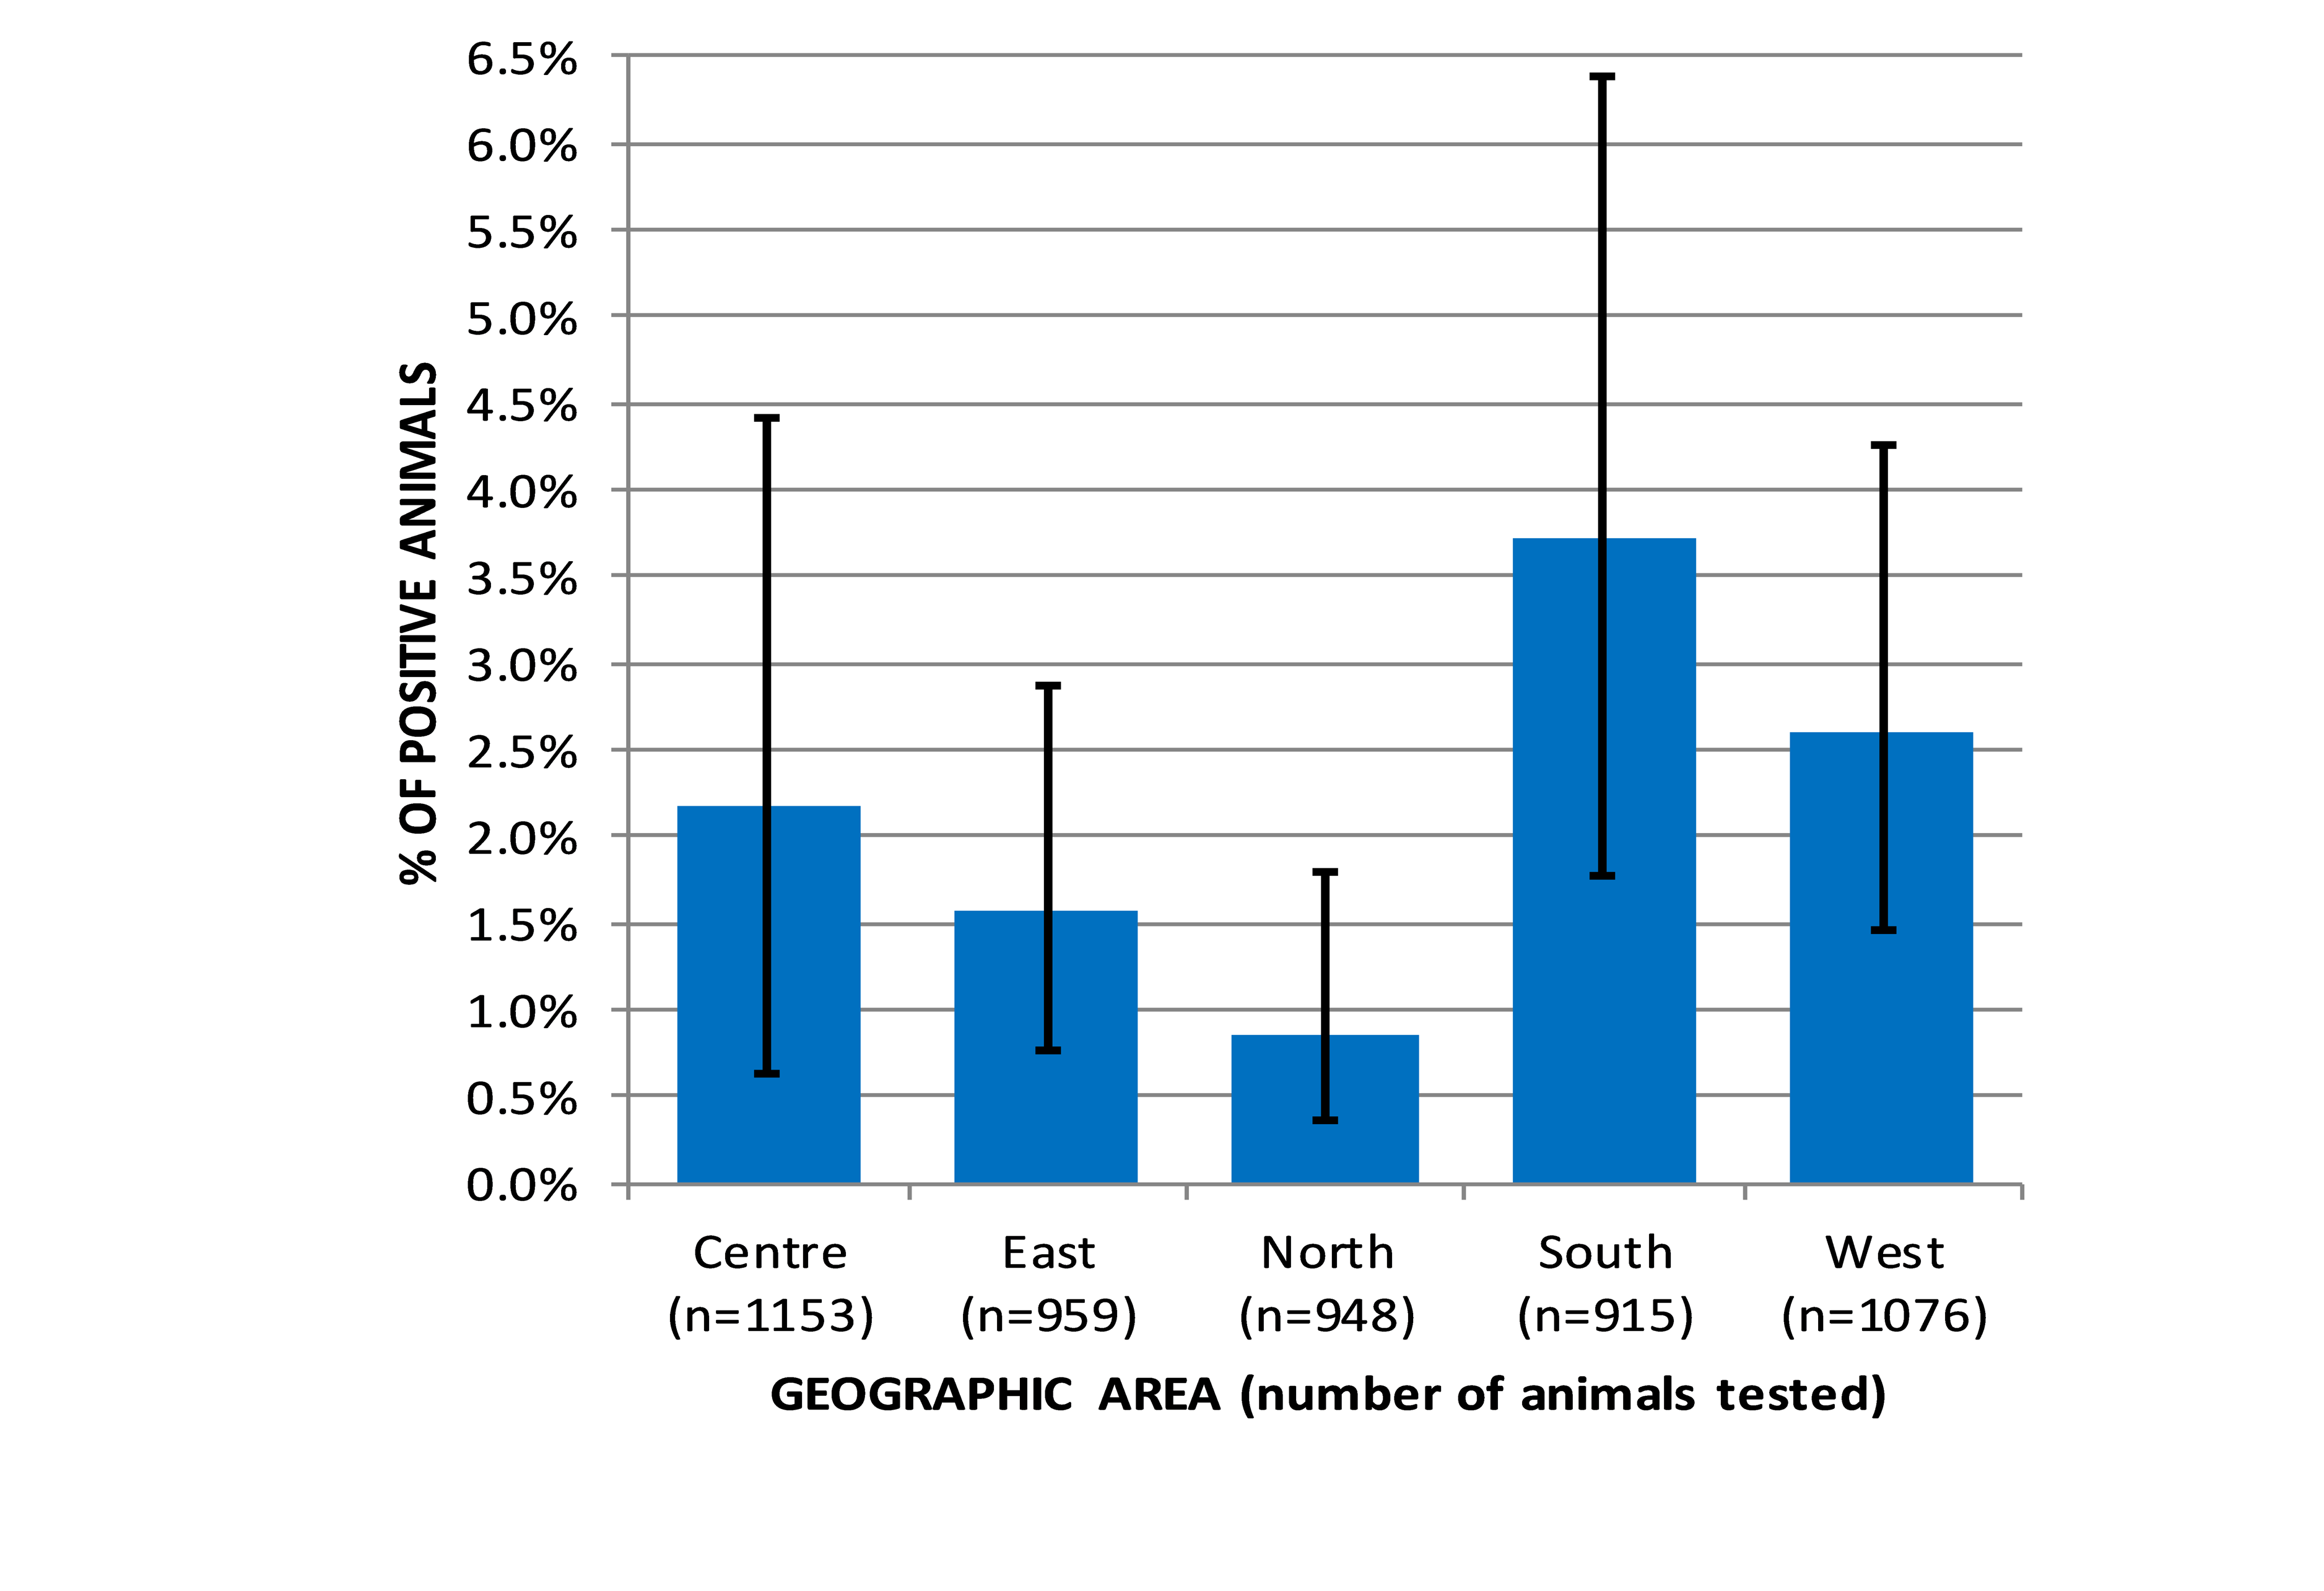 Figure 3.
 Bovine leukemia virus sero‐prevalence (ELISA) in adult cattle across Kosovo in 2016, stratified by geographic area. The error bars indicate the Wilson score 95% c.i. inflated by the square root of the design effect, to account for the effect of two‐stage sampling
DISCUSSION
Serological test is widely used today for successful control, eradication, surveillance and monitoring. Their application is mandatory for the establishment and maintenance of an officially BLV-free herd status and certification required for trade in bovine animals within the European Union, Council Directive 64/432/EEC as regards the diagnostic tests for enzootic bovine leukosis (2009/976/EU) (
15). Sero-conversion occurred during 2-3 weeks and antibody response is lifelong, thus making assay fit for the purpose. Various ELISAs are commercially available and generally good agreement between assays is expected (
12).
This is the first countrywide sero-prevalence survey of BLV in Kosovo. Animals tested represent 1.42% of overall registered cattle population at the time of sampling. BLV sero‐positive cattle were found in all of the geographic areas of Kosovo with individual sero-prevalence of 2.26% (95% c.i. 1.62% to 3.04%), weighted for geographic distribution of samples. Although not statistically significant, the data show that sero‐prevalence in cattle 5 to <6-year-old is higher than in younger and older age groups. While cattle may be infected at any age, it is assumed that as animals get older, the cumulative probability of BLV exposure increases, which would lead to a higher sero-prevalence (
21,
22). Similarly, in both studies, decrease in sero-prevalence in cattle over 6 years is observed. This cannot be explained solely on the basis of progressive clinical effect of BLV infection alone, since lymphosarcoma develop in less than 5% of BLV infected cows. There is growing evidence that BLV disrupts normal immune functioning and increases the risk of developing other infectious diseases (
23). Moreover, dairy cattle with high genetic potential for milk production which are more susceptible to BLV (
22,
24,
25) are also predisposed for diseases that may or may not be linked to BLV, such as mastitis, fertility issues, lameness, metabolic diseases etc. which are the main reasons for premature culling of cows (
26).
In the present study we found no statistically significant differences in BLV sero-prevalence in cattle between herd size. The relationship between BLV herd prevalence and herd size is not consistent across all studies. BLV is not a disease which spreads rapidly. Risk of higher within-herd BLV prevalence could be associated with common herd management practices which are more or less the same in herds of different sizes, rather than herd size itself (
27). Details of breed were not recorded in this survey, but in Kosovo larger herd size may be associated with higher proportion of pure breeds of cattle, such as Holstein and Limousine, compared to local breeds.
Sero‐prevalence for BLV was found to be highest in the south and west geographic areas, with aggregated prevalence of 3.11%, compared to 1.57% aggregated prevalence for the centre, east and north. Based on current data it is difficult to find any scientifically based reason for differences in sero-prevalence between geographic areas. There are no differences in cattle management practices between regions. Uncontrolled movement of animals is frequent across all the country. The south and west regions do have a milder climate and higher annual precipitation, so future studies should focus more on different agro-ecological and climatic factors and the activity of potential vectors.
Of the 315 villages sampled, 55 (17.5%) had at least one animal that was positive on the BLV ELISA. However, the survey was not designed to estimate village prevalence with any specified accuracy or precision. The main limiting factor of this survey, with respect to estimating the percentage of villages with BLV sero‐positive cattle, is the number of cattle that were sampled in each village. On average, 16 samples were obtained per village. This was sufficient to estimate overall individual prevalence across Kosovo with a good level of precision, but is too small sample to rely on to accurately identify the village as ‘positive’ or not. This is especially problematic if the within village prevalence of BLV‐positive cattle is very low, which is likely to be the case because BLV is not a rapidly spreading infection. Equations provided in Cannon and Roe (
20) can be used to indicate sample sizes required for cattle sampling at village level. The sample size required to give 95% probability of detection of at least a 5% within village sero‐prevalence, for villages with about 200 adult cattle would be 51 adult cattle. The ‘detection sensitivity’ at village cluster level, with sampling of only 16 adult cattle, can also be estimated using equations provided in Cannon and Roe, and could be lower than 60% (meaning that less than 6 out of 10 positive villages may be actually detected). Therefore, for village prevalence, the results should be viewed conservatively, with the possibility in mind that the true percentage of villages affected may be significantly higher than the percentage apparent from the survey results.
Eradication programs have been developed and implemented in other countries. It proved to be successful in Australia, New Zealand and in west European countries where BLV infection has been eradicated and the countries are classified as officially BLV-free by the EU (2014/441/UE). In other countries of Europe, the eradication process is under way. In other parts of the world success has been variable, primarily because of the expense and high prevalence of infection among cattle relative to the economic cost of disease (
1). The overall low prevalence of BLV in Kosovo means that direct economic impact of BLV in Kosovo may be of limited importance currently. However, economic impact may increase if the infection is allowed to spread unchecked. Therefore, these data should be used to support eradication efforts while prevalence remains low. The expenses of eradication could outweigh the current economic cost of disease, but in the long term the benefits of being a BLV free country could be much higher. The main challenge we expect is to increase the level of awareness and concern about BLV among farmers as a problem in their herds, especially because most of infected animals show no clinical symptoms. However, if there is a political will and with substantial efforts eradication of BLV in Kosovo could be possible in coming years. This could lead one step forward to the common EU market.
CONFLICT OF INTEREST
The authors declare that there is no conflict of interest related to this article.
ACKNOWLEDGEMENTS
We greatly acknowledge the veterinarian colleagues from the different municipalities of Kosovo, for their support during the blood sample collection. This survey was implemented by a project funded by the European Union and implemented by the Consortium Agrotec SpA/NIRAS/IZSve. Namely: Technical assistance for the Animal health Department of the KFVA and the Food and Veterinary Laboratory (Kosovo). Reference no. EUROPEAID/133795/DH/SER/KX. The content of this document are sole responsibility of the author and can in no way be taken to reflect the views of the European Union or of the Agrotec SpA / NIRAS / IZSVe Consortium.
AUTHORS‘ CONTRIBUTIONS
VGj wrote the manuscript and he was the local coordinator of the project. AC did the critical revision of the manuscript, laboratory analysis and data collection. MA was coordinating field work and data collection. DM carried out the laboratory analysis. NT proposed the study design, performed statistical analysis, as well as critical revision of the manuscript. NH was a team leader, project coordinator and did the critical revision of the manuscript.

 10.2478/macvetrev-2020-0030