Analytical methods based on immunoaffinity column clean-up and quantitative determination with liquid chromatography-fluorescence detection were used to determine aflatoxins and ochratoxin A in liver samples. The validation of the procedures was performed. The linearity of the methods was checked, and a good coefficient of correlation was found for all aflatoxins and OTA as well. The LOD and LOQ were acceptable: 0.003 μg/kg and 0.009 μg/kg for AFB1; 0.001 μg/kg and 0.005 μg/kg for AFB2; 0.006 μg/kg and 0.020 μg/kg for AFG1; 0.007 μg/kg and 0.022 μg/kg for AFG2; 0.08 μg/kg and 0.27 μg/kg for OTA. The results for the repeatability estimated by the relative standard deviation (RSDr) were satisfactory and the obtained values were in the acceptable range (1.97–14.41% for all aflatoxins and 3.76-8.31% for OTA) at three proposed concentration levels. RSDR values showed acceptable correlation between two analysts for all four aflatoxins and OTA. The RSDR values were as followed: 2.37% and 5.60% for AFB1, 6.71% and 8.78% for AFB2, 4.40% and 7.00% for AFG1 and 10.30% and 13.91% for AFG2 (for the first and second analyst, respectively). The RSDR values for OTA were 4.91% and 3.15% (1 μg/kg); 3.76% and 4.12% (5 μg/kg) and 8.31% and 8.21% (10 μg/kg). The mean recovery for total aflatoxins and OTA were 78.10% and 93.34%, respectively. All validation parameters were in accordance to European legislation. They indicate that the proposed analytical procedures are suitable and they could be methods of choice for the determination of aflatoxins and OTA in liver samples.
Mycotoxins are secondary metabolites produced by various genera of molds (
Aspergillus, Penicillium, Fusarium). Cereals contaminated with mycotoxins, when are ingested by animals, can cause a toxic response (mycotoxicosis) resulting with carcinogenic, estrogenic, teratogenic or immunosuppressive effects (
1). Consumption of a mycotoxin-contaminated diet may have direct consequences on animal health and economic impact as well. This includes reduced weight gain and reproductive capacities, feed refusal and poor feed conversion, less meat and egg production, increased disease incidence (due to immunesuppression) and lower productivity (
1-2).
Due to modern laboratory methods and a growing interest in this field of research, more than 300 mycotoxins have been differentiated so far. Among them, aflatoxins, especially aflatoxin B1 (AFB1) exhibits the highest toxicity and carcinogenicity and it can be found as a residue in animal liver after ingestion of contaminated feed (
3). International Agency for Research on Cancer (IARC) made classification of naturally occurring AFB1 as carcinogenic to humans (Group 1). Ochratoxin A (OTA) contamination is also a significant public food safety concern due to accumulation of its residues in animal tissues, predominant in kidney, but also in liver, muscle and fat. OTA is involved in the etiology of Balkan Endemic Nephropathy (BEN), a human disease characterized by progressive renal fibrosis and by tumors of the urinary tract. IARC made classification of OTA as possibly carcinogenic to humans (Group 2B). Mycotoxin content in food and feed is regulated by legislation worldwide (Commission Regulation 466/2001, 2174/2003, 1881/2006 for food and Commission Directive 2002/32 and 2003/100 for feed). The Commission of European Communities has not set maximum residue limits (MRL) for mycotoxins in animal tissues, but it recommends that OTA levels should be reduced to below 5 ng/kg of body weight per day. Several countries have enforced their own regulation for animal origin foodstuff. They are vary in the range of 1-10 μg/kg for pork and bovine meat (
4).
Different analytical methods are used for aflatoxins and OTA analysis which are mainly based on liquid chromatography with fluorescence detection and previous clean-up step. Most of them are greatly improved with the commercial availability of immunoaffinity columns (IAC), which are simple and rapid to use, also provide good recovery values. Several articles report the use of these methods for aflatoxins (
5, 6, 7) and OTA (
8, 9, 10) in food and feed. To the best of our knowledge, very few reports give methods for determination of aflatoxins (
11, 12) and OTA (
13, 14, 15) in food of animal origin. Having in mind the significant health risks in human and animals associated with the presence of aflatoxins and OTA in food and feed, it is important to establish an analytical method for the determination of aflatoxins and OTA in food of animal origin.
The purpose of this work was to provide and validate a precise and reliable analytical methods for determination of aflatoxins and OTA in animal liver using simple immunoaffinnity column clean-up and liquid chromatography with fluorescence detection. Postcolumn bromination (Kobra®cell) was used in order to determine aflatoxins. The validation procedure was performed according to European Decision 2002/657/EC (16) and Regulation 401/2006/EC amending mycotoxins (
17). Also, the aim of this study was to carry out an overview for presence of aflatoxins and OTA in animal liver samples taken from slaughterhouses in Republic of North Macedonia over the period of six years (2015-2020). To the best of our knowledge, such investigation has not be done so far in our country. This research would provide a screening of the natural occurrence of aflatoxins and OTA in animal tissues, having in mind its potential health hazard for human consumption.
MATERIAL AND METHODS
ApparatusHPLC analysis for aflatoxins were performed with a Perkin Elmer (PE) chromatographic system equipped with binary pump (PE LC-250), manual injector (PE Rheodyne 7125) and fluorescence detector (PE LC-240). Aflatoxins were separated on RP C18 column (250 mm x 4.6 mm, 5 μm). The mobile phase consisted mixture of water:acetonitrile:methanol (600:350:50,
V/V/V) with addition of 119 mg KBr and 350 ml 4N HNO3). The flow rate was 1 ml/min and the injection volume was 100 ml. The detection was carried out at ʎex = 360 nm and ʎem = 440 nm.
HPLC system (Waters Alliance) was used for determination of OTA (Waters separation module e2695 and Waters fluorescence detector 2475). An analytical column RP C18 (150 mm x 4.6 mm, 5 μm) was used with mobile phase consisting of acetonitrile:water:acetic acid mixture (99:99:2,
V/V/V). Flow rate was 1 ml/min. The detection was carried out at ʎex = 333 nm and ʎem = 460 nm.
Reagents and standard solutionsHPLC reagents (methanol, acetonitrile, water) and chemicals (benzene, KBr, NaCl, dichloromethane, ethyl acetate, citric acid, diatomaceous earth, anhydrous Na2SO4, 65% HNO3, 85% phosphoric acid, glacial acetic acid, 2M NaCl, 0.5 M H3PO4, phosphorus buffer 7.0 or PBS buffer) were purchased from Merck (Darmstadt, Germany) or Sigma-Aldrich (USA). For clean-up step immunoaffinity columns Aflaprep and Ochraprep (R-Biopharm Rhône, Glasgow, Scotland) were used.
As a standard, aflatoxins mix (AFB1 982 ng/ml, AFB2 284 ng/ml, AFG1 1034 ng/ml, AFG2 333 ng/ml) (Supelco, Sigma-Aldrich, USA) was used and OTA standard with concentration of 50 μg/ml (Supelco, Sigma-Aldrich, USA) was used too.
Aflatoxins mix stock solution (AFB1 100 ng/ml, AFB2 28.4 ng/ml, AFG1 103.4 ng/ml, AFG2 33.3 ng/ml) was prepared from the aflatoxins mix standard, dissolving aliquot in a volumetric amber flask of 10 ml. Seven working standard solution (for AFB1 in a range 0.25-15.00 ng/ml; for AFB2 in a range 0.071- 4.260 ng/ml; for AFG1 in a range 0.258-15.510 ng/ml and for AFG2 in a range 0.083-4.990 ng/ml;) were prepared from the stock solution in volumetric amber flasks of 5 ml. All working standards were kept in a refrigerator at 2-8 °C.
Aliquot of OTA standard (50 μg/ml) was used to prepare an OTA stock solution with concentration of 5.0 μg/ml using salinized glass vial in order to keep the mycotoxin in the solution. It was used for preparation of intermediate solutions with concentration of 1000 ng/ml and 100 ng/ml. Seven working solution in range 0.10–20 ng/ml were obtained from the intermediate solution at 100 ng/ml. All working standards were dissolved in filtrated mobile phase and were kept in a refrigerator at 2-8 °C.
SamplesDuring validation procedure, samples of animal liver were used, purchased in the local market, intended for human consumption. For validation purpose, samples were spiked with AFB1 working standard solution prior to the extraction, at three concentration levels (0.10, 0.25 and 0.50 μg/kg).
For OTA spiking, also three concentration levels were analyzed (1.0, 5.0 and 10.0 μg/kg). Those portions of standards were applied to a measured liver sample and they were kept for approximately 30 min. to addition of the extraction solvent.
For screening purpose, animal liver samples were taken from slaughterhouses or brought by food inspectors from all over the country. They were stored in specimen containers at -18 °C until analysis.
Analytical procedureThe extraction and purification of aflatoxins from liver samples was done according to our reference (
12) and modified AOAC procedure (
18). HPLC-FD detection was performed according to ISO 16050:2003 standard (
19). Homogenized liver sample (50.0 g) was mixed well with 5 ml of 20% citric acid and 10 g diatomaceous earth. The mixture was extracted with 100 ml dichloromethane on shaker for 30 min. Then, the mixture was filtered and dried by addition of 5 g anhydrous Na2SO4 and filtered again. Twenty (
20) ml of the filtrate was evaporated until dryness at 60 °C. Dry residue was dissolved in 5 ml of methanol and the solution was mixed with 25 ml of phosphorus buffer (pH 7.0). The solution was mixed well and filtered again through microfiber filter. The entire sample was applied onto the immunoaffinity column. Ten (
10) ml of water was used for the washing step. Aflatoxins were eluted with 1 ml of methanol. The elution step was repeated one more time with 1 ml of water. Then, 100 μl of methanol-water solution was used for further analysis.
The process for extraction and purification of OTA in animal tissues was done according to modified method (
14). Volume of 10 ml extraction solvent (dichlormethane:ethyl acetate (1:3)) and 10 ml 0.5 M H3PO4 in 2M NaCl was added to 25 g tissue sample and blended or homogenized in a baker for a few minutes. Then the samples were put for 30 min on a horizontal shaker. The mixture was filtered using filter paper. An aliquot of the filtrate (10 ml) was evaporated to dryness. Dry residue was dissolved in 2 ml methanol and 30 ml PBS buffer. Then the solution was filtered again using microfiber filter. Twenty (
20) ml of the filtrate passed through the immunoaffinity column. Twenty (
20) ml of water was use for washing step. OTA was eluted with 4 ml of methanol in a vial. The solution was evaporated under of stream of nitrogen until dryness. The dry residue was re-dissolved in 1 ml of mobile phase for further chromatographic analysis.
Validation procedure
The validation procedure was achieved in agreement to general Decision 2002/657/EC (
16) and Regulation 401/2006/EC (
17) which is related to mycotoxins. Seven working standard solutions were used for the linearity test in the following range: for AFB1 (0.25-15.00 ng/ml), for AFB2 (0.071-4.260 ng/ml), for AFG1 (0.258-15.510 ng/ml), for AFG2 (0.083- 4.990 ng/ml) and OTA (0.1–20.0 ng/ml).
The limit of detection (LOD) was calculated as 3.3xSD/slope, where the slope was determined from the calibration curve. Standard deviation (SD) was based on measurement of analytical background response of 10 blank samples. The limit of quantification (LOQ) was calculated as 10xSD/slope in the same way as LOD calculation.
Because the certified reference material was not available, recovery was determined as a part of trueness of the method. Method for standard addition at the following fortified concentration levels was applied: for AFB1 (0.10, 0.25 and 0.50 μg/kg), for AFB2 (0.028, 0.071 and 0.142 μg/kg), for AFG1 (0.103, 0.258 and 0.517 μg/kg), for AFG2 (0.033, 0.083 and 0.166 μg/kg) and for OTA (1.0, 5.0 and 10.0 μg/kg), using liver sample which was free from aflatoxins and OTA (previous determined with HPLC-FD). The analysis was performed with six replicates at each level of fortification.
Repeatability was predicted through the standard deviation and relative standard deviation, using the data of the recovery measurements. Within-laboratory reproducibility of the method was determined in the same fortified concentration levels with six replicates at each level. Those steps were repeated in different days, using the same methods and the same apparatus. Two different analysts performed the analysis.
The expanded measurement uncertainty U at the proposed concentration level (0.50 μg/kg and 5.0 μg/kg for AFB1 and OTA, respectively) was calculated from the within-laboratory reproducibility and other factors: standard solution, pipettes that we used and balance as well, using coverage factor 2 (95% confidence level). All of those factors were adjusted as a percentage according to NIST Uncertainty Guideline (
20).
RESULTS
Seven-point calibration curves were linear in the suggested concentration range for all four aflatoxins and OTA as well, with satisfactory coefficient of correlation (R2>0.998). The methods were appropriate over the tested concentration range, having in mind that there is no requirement for the maximum permitted level of aflatoxins and OTA in liver within European legislation.
The chromatograms obtained when IAC clean-up procedure was performed, were clean, with flat baseline, no matrix effects and practically no impurity and unidentified peaks, as can be seen in
Fig. 1 and
Fig. 2.
The limit of detection was acceptable (for AFB1 it was 0.003 μg/kg; for AFB2 0.001 μg/kg, for AFG1 0.006 μg/kg and for AFG2 0.007 μg/kg). Limit of quantification was also satisfactory (for AFB1 it was 0.009 μg/kg; for AFB2 0.005 μg/kg, for AFG1 0.02 μg/kg and for AFG2 0.022 μg/kg). LOD and LOQ values for OTA were found 0.08 μg/kg and 0.27 μg/kg, respectively.
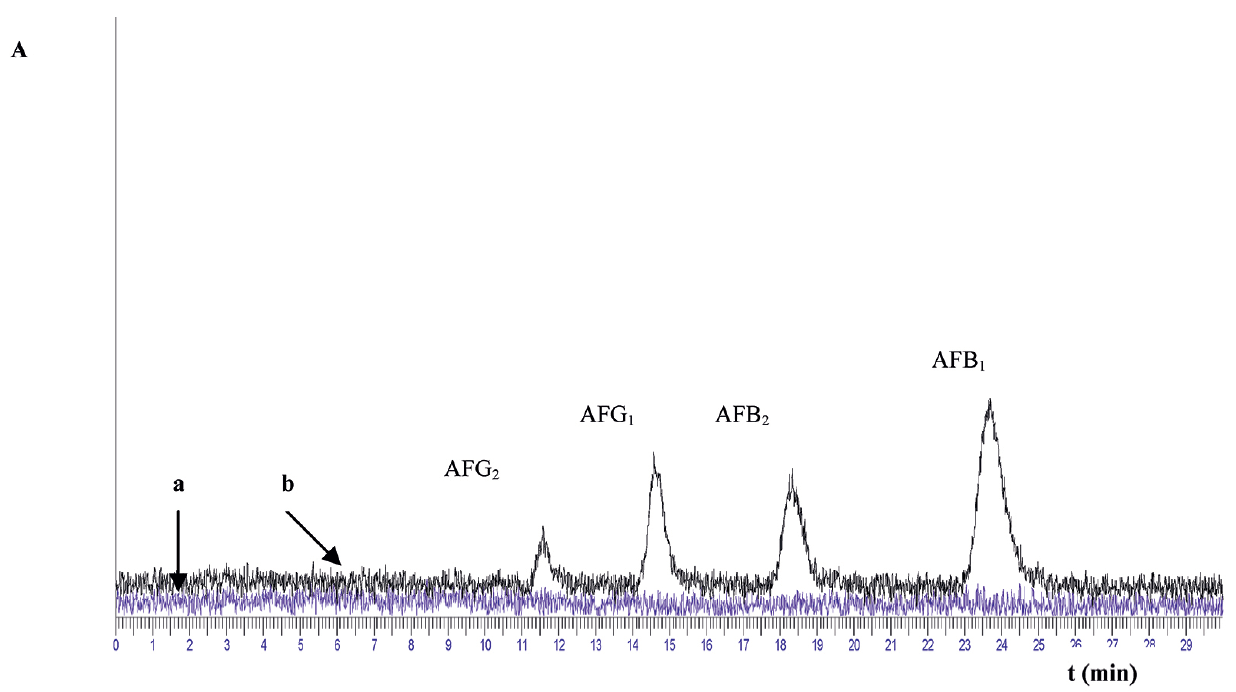 Figure 1.
 Chromatograms of (a) blank liver sample and (b) fortified liver sample with concentration of AFB1 0.50 μg/kg; AFB2 0.142 μg/kg; AFG1 0.517 μg/kg and AFG2 0.166 μg/kg
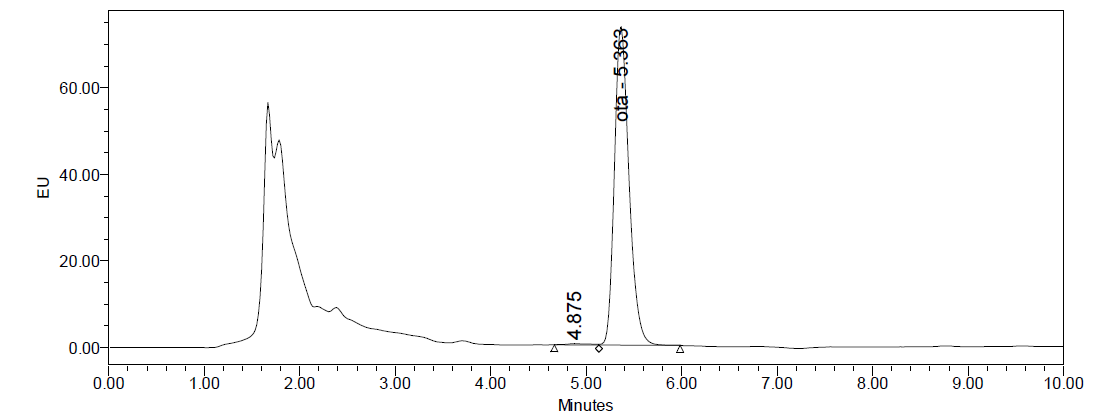 Figure 2.
 Chromatogram of fortified liver sample with concentration of OTA 5.0 μg/kg
The results for the repeatability estimated by the relative standard deviation (RSDr) are presented in
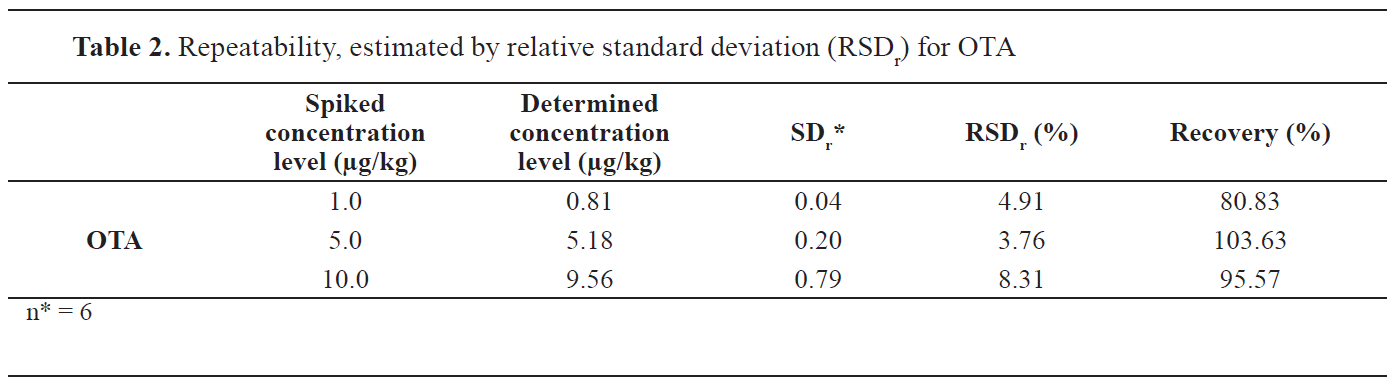
Table 1 at three proposed concentration levels for all four aflatoxins. Accuracy and precision results for OTA are presented in
Table 2. The results for the recovery are given in the same
Table 1 and
Table 2 for aflatoxins and OTA, respectively.

In
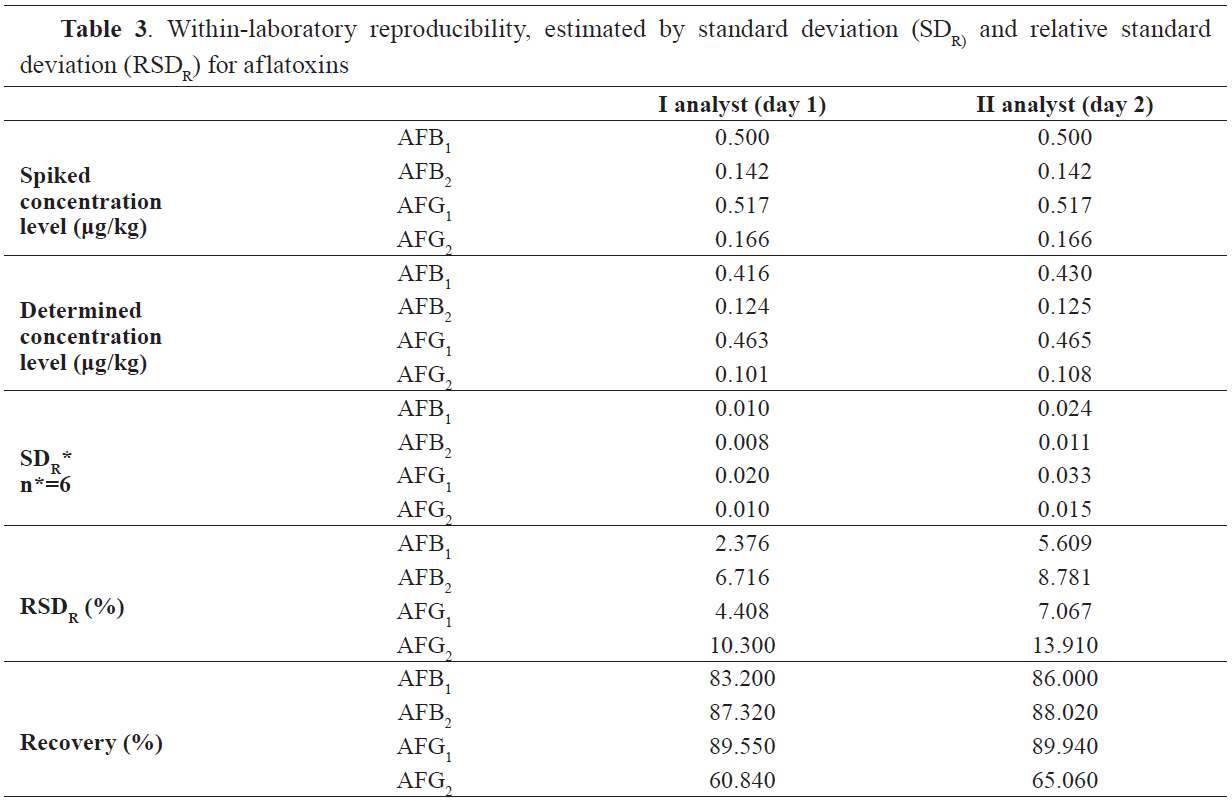
Table 3 the results for the within-laboratory reproducibility expressed with the standard deviation (SDR) and the relative standard deviation (RSDR) are given. RSDR values results show adequate correlation in all four aflatoxins. For AFB1 RSDR values were 2.37% (for the first analyst) and 5.60% (for the second), for AFB2 values were 6.71% and 8.78%, for AFG1 values were 4.4% and 7.0% and for AFG2 values were 10.30% and 13.91%, respectively.
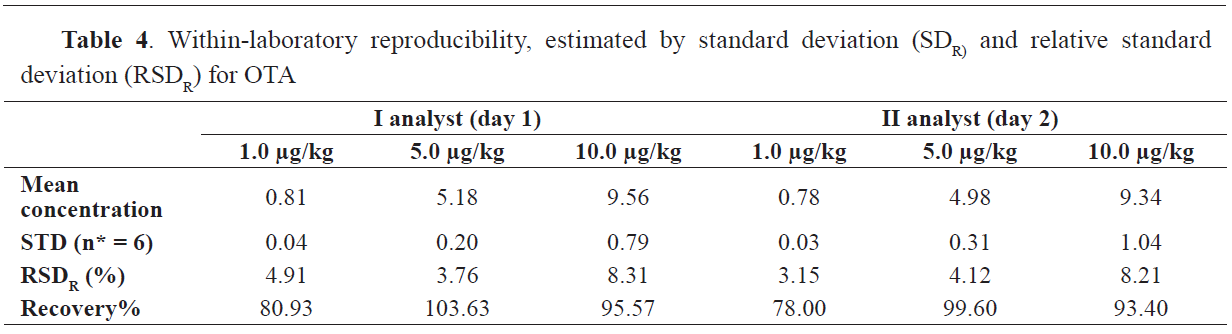
Reproducibility results for two days for OTA are demonstrated in
Table 4. Within-laboratory reproducibility for OTA also show good correlation between two days (4.91% and 3.15% for the concentration level of 1.0 μg/kg; 3.76% and 4.12% for the concentration level of 5.0 μg/kg and 8.31% and 8.21% for the concentration level of 10.0 μg/kg).
The stability of the method was approved following the recovery over a period of one year. The values obtained for recoveries are presented in
Fig. 3 and
Fig. 4.
 Figure 3.
 Shewhart control chart for AFB1 (spiking level 0.50 μg/kg)
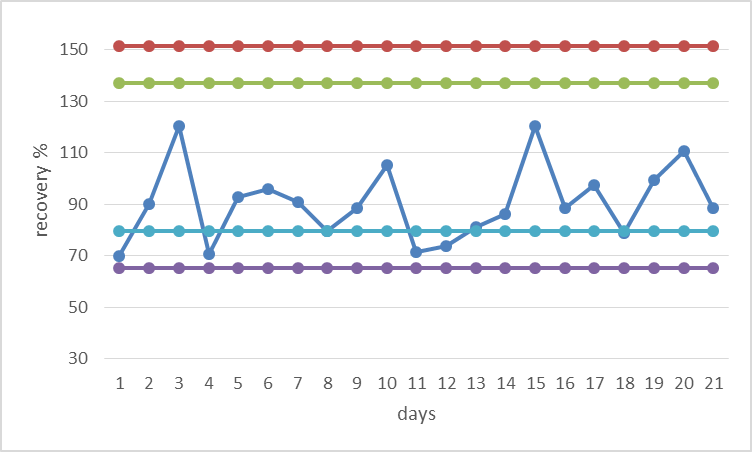 Figure 4.
 Shewhart control chart for OTA (spiking level 5 μg/kg)
The measurement uncertainties determined at the proposed concentration level (0.50 μg/kg for AFB1 and 5.0 μg/kg for OTA) were 15.50% and 11.26 % for AFB1 and OTA, respectively.
The monitoring of presence of aflatoxins and OTA in animal liver samples was conducted over a period of six years (2015-2020). In thirty seven (37) samples out of 297 OTA was present in concentration range of 0.130-0.922 μg/kg. Most of the samples were with OTA concentration below LOD. No one sample was found for presence of aflatoxins. Chromatogram of liver sample with concentration of OTA 0.86 μg/kg is presented on
Fig. 5.
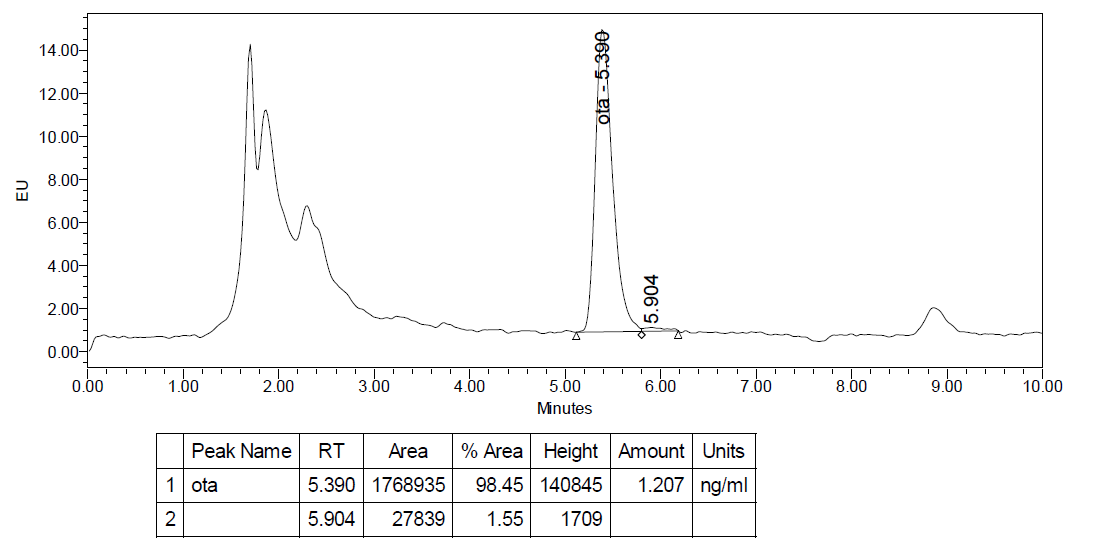 Figure 5.
 Chromatogram of liver sample with concentration of OTA 0.86 μg/kg (dilution factor is 1.4)
DISCUSSION
Linearity of the methods with high coefficients of correlation demonstrated reliable results. As can be seen in
Fig. 1,
Fig. 2 and
Fig. 5 there is no potential risk of interfering compounds around selected mycotoxins. This is a due to the IAC selectivity. The columns which are considered to be state-of-the-art in the field of analytical chemistry, contained a gel suspension of monoclonal antibody specific to the toxin of interest. Spiked blank liver sample showed good peaks separation, specific for preferred mycotoxin (
Fig. 1). Hence, taking into account the characteristics of IAC, the selectivity and specificity were recognized to be satisfactory for bought methods. We compared some studies (
14, 15, 21, 22) with the methods we worked on, and our study showed efficiency and appropriateness for detection of the very low levels for determined mycotoxins (low LOD and LOQ values).
All results obtained from the validation procedure were suitable for evaluation according to the criteria (
16, 17). Our results for repeatability, determined by RSDr (
Table 1 and
Table 2) were in the acceptable range (1.97–14.45% for all aflatoxins and 3.76–8.31% for OTA) according to the benchmark (mean value for RSDr shall not exceed 20%). Recovery values as a part of trueness, were satisfactory and in accordance to European legislation (2002/657/EC) and performance criteria set up in Commission Regulation 401/2006. They were in range of 47.61-90.13% as a recovery for individually aflatoxins, or as mean recovery for total aflatoxins (78.10%). For OTA, recovery values were in the range of 80.83–103.63% for three concentration levels of determination. As reported by regulation (
16), data corrected with the recovery are only acceptable when they fall within the range -50% to +20% of measured value. Within-laboratory reproducibility, estimated by standard deviation (SDR) and relative standard deviation (RSDR) given in
Table 3 and
Table 4 were considered acceptable.
The stability of the method, which was tested through the recovery, showed satisfactory results. The values for recoveries were found to be stable over the tested period, having in mind the Shewhart control chart (
Fig. 3 and
Fig. 4). These limits of the chart, reflect that the process operate as consistently as possible without fundamental changes.
The results obtained from the conducted monitoring for presence of aflatoxins and OTA in animal liver samples, showed presence of OTA in 12.45% of samples (37 out of 297). OTA was present in very low concentration range (0.130-0.922 μg/kg). The greater number of the samples (87.55%) were although some studies (
14, 15, 22, 23) showed higher value of OTA in pig tissues (more than 15.0 μg/kg). We didn’t find any sample with presence of aflatoxins. Although there isn’t official MRL’s for mycotoxins in animal tissues, the attention should be paid and regular monitoring for presence of mycotoxins should be organized.<
CONCLUSION
It was confirmed, through the validation procedures, that the proposed methods are rapid, reliable, providing satisfactory recoveries (mean value for total aflatoxins was 78.10% and mean value for OTA was 93.34%), with acceptable precision values in the range of 1.97–14.41% for all four aflatoxins and 3.76-8.31% for OTA, at three proposed concentration levels. The methods also showed high peak selectivity and low values for LOD and LOQ. All the validation parameters are in accordance to the requirements of European regulation and all of them indicate that those methods are suitable for the determination of aflatoxins and OTA in animal liver. The methods were found to be applicable to determine significantly low concentration of proposed mycotoxins. The overall overview in a period of six years, showed no significant contamination in liver samples in Republic of North Macedonia. However, regular aflatoxins and OTA monitoring plan in animal liver is highly recommended.
CONFLICT OF INTEREST
The authors declared that they have no potential conflict of interest with respect to the authorship and/or publication of this article.
ACKNOWLEDGEMENTS
This research was supported by the Faculty of Veterinary Medicine, Ss. Cyril and Methodius University in Skopje.
AUTHORS’ CONTRIBUTION
BSD conducted the validation, analyses, interpretation of the results and she wrote the manuscript. EDS and ZHM supervised the laboratory work and they corrected the manuscript. RU and KB supervised the conduction of validation and participated in the interpretation of results. AA conducted the laboratory work. DJ organized the laboratory work and corrected the manuscript.

 10.2478/macvetrev-2021-0017