As the number of genetically modified crops increases rapidly, their accurate detection is significant for labelling and safety assessment. Currently, real-time PCR is the “golden standard” method for GMO detection. Hence, extraction of high quality DNA represents a crucial step for accurate and efficient DNA amplification. For GMO presence evaluation in the extracted DNA from raw corn kernels and roasted soybean, we used real-time PCR method, in consistent with the ISO17025 accreditation standards. As for DNA extraction, modified basic SDS protocol by adding RNase A enzyme in different steps of the protocol, with different time and temperature of incubation was used. The results showed as most suitable, the protocol where 10 μl of RNase A enzyme was added together with the lysis buffer at 65 °C for 30 minutes. Data for DNA yield and purity for roasted soybean was 469.6±3.3 μg/ml with A260/280 absorbance ratio 1.78±0.01. Suitability of DNA extracts for GMO analysis was assessed by screening for the presence of 35S promotor and Tnos terminator. Diluted extracts in concentrations 10, 1, 0.1, 0.01 and 0.0027 ng/μl, were tested in six replicates. Positive signal of amplification (LOD) was detected in all concentrations for both genetic elements in both matrices. The LOQ for 35S and Tnos for both matrices was 0.1 ng, while for Tnos in raw corn kernels was 0.01 ng. This in-house developed DNA extraction method is simple and obtains high-quality DNA suitable for GMO screening of 35S promotor and Tnos terminator in both raw and processed matrices.
Despite the advantages of the use of GMO in human and animal nutrition, they still pose a serious risk for their health and welfare, as well as for leaving a footprint on the environment. Therefore, their production, release into the environment and use, should be strictly monitored following Regulation 1829/2003 (
1) and Directive 2001/18/EC (
2). The EU regulation states mandatory labelling of GMO in food and feed in concentration above 0.9%, while concentrations up to 0.9% are allowed only to authorized GMOs, meaning that a reliable method should be used for GMO detection in raw materials and highly processed food.
Several methods for GMO screening have been developed, optimized and validated, but DNA-based methods, like real-time PCR technique has proven to be precise and sensitive recognized reference method for qualitative and quantitative detection of target genetically modified DNA sequences (
3, 4, 5, 6). There are many different extraction methods, which result in obtaining DNA with different levels of purity and yield, as well as integrity, in diverse types of food matrices. Hence, the purity of the extracted DNA acts as a prerequisite for a successful amplification, taking into consideration the fact that food is a complex matrix rich with compounds that might inhibit DNA amplification (
7). Besides inhibitors such as polysaccharides (
8), phenols and proteins (
9) additionally, food often undergoes thermal processing, that affects DNA integrity and stability (
10). However, very often RNA could act as a contaminant of the DNA extract, seen as an increase in the A260/280 ratio, because it absorbs the ultraviolet light at 260 nm as well as DNA (
11, 12). RNA contamination could also be seen on gel electrophoresis as a smeared band. Therefore, the removal of the RNA contamination is an essential step in the DNA extraction protocol. Adding
RNase A enzyme to the extraction protocol could be of significant importance and an asset in obtaining DNA extract with high purity and integrity.
The method described below illustrates how the addition of
RNase A enzyme to previously optimized SDS protocol can isolate high quality genomic DNA from raw and processed matrices, free of contamination and suitable for real-time PCR amplification.
MATERIAL AND METHODS
DNA extractionRoasted soybean (random sample for analyses) as processed matrix and raw corn kernels (Certified reference material, MON 89034, AOCS, Illinois, USA) were used for DNA extraction. Both matrices were previously confirmed for the presence of 35S and Tnos, with a commercially available kit (GeneScreen, Eurofins, Germany). DNA was extracted with modifications to the previously optimized SDS method (
12). This protocol includes incubation for 30 minutes at 65 °C with 2% SDS lysis buffer, followed with organic solvent step for protein and lipid removal and agitation and centrifugation at 400 rpm/15 min and 13.000 rpm/5 min, respectively. The supernatant was treated with isopropanol, centrifuged and after the pellet was washed once with 96% ethanol and three times with 70% ethanol. The pellet was air-dried, suspended in TE buffer (preheated at 65 °C) and incubated at 65 °C/3 min.
There were modifications made in adding
RNase A enzyme in different steps of the optimized SDS protocol, labelled as protocols A, B and C (
13, 14). Protocol A consisted of adding 10 μl
RNase A enzyme (10 mg/ml) to the cell lysate and incubated for 15 minutes at 37 °C. In Protocol B, 10 μl of
RNase A enzyme (10 mg/ml) was added to the supernatant obtained after centrifugation of the first organic solvent step extraction and then incubated at 37 °C for 15 minutes. As for Protocol C, it consisted of adding 10 μl of
RNase A enzyme (10 mg/ml) to the modified SDS buffer for cell lysis and incubation of the mixture together at 65 °C for 30 minutes along with continuous shaking at 320 rpm. After
RNase A enzyme was added, all modifications followed the previously optimized SDS method (
12).
Determination of DNA concentration, purity, yield and integrityDNA concentration and purity was measured with NanoDrop Spectrophotometer 2000 (Thermo Fisher Scientific, USA). DNA purity was estimated by the absorbance ratio A260/280, while DNA yield was calculated with the following formula:
DNA yield (μg) = DNA concentration (ng/μl) * total sample volume (ml)
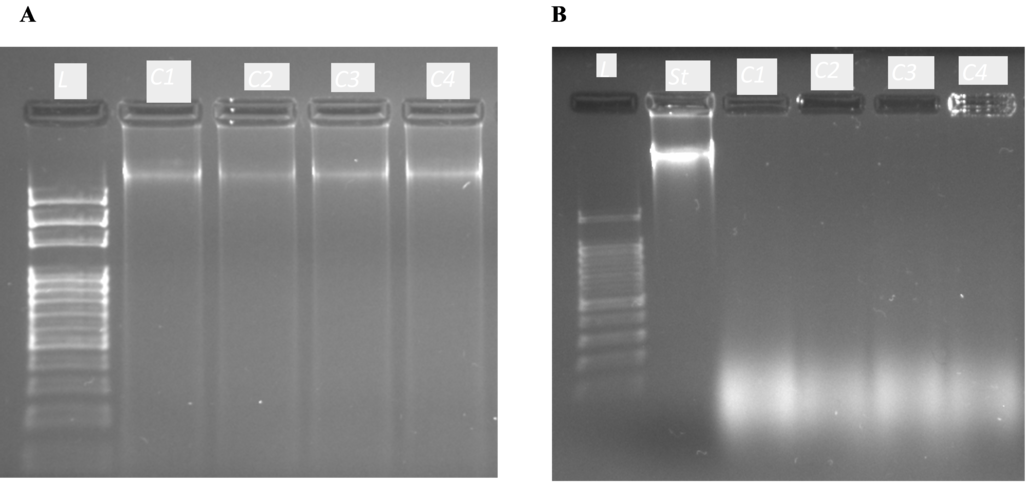
Agarose gel electrophoresis with 1x TBE buffer for 2 hours at 70 V was used to evaluate the DNA integrity. Later, the 1.5% agarose gel was stained with ethidium bromide and visualized under UV light using Gel doc XR+ imager (Bio-Rad, USA).
Modification of protocol CProtocol C, where
RNase A enzyme (Thermo Fisher Scientific, USA) was added along with the lysis buffer, had a modification referring to the amount and incubation time of the
RNase A enzyme. The combinations named as protocol C1 to C4 are given in
Table 1. For further evaluation of the DNA extract for GMO screening by real-time PCR, protocol C4 was taken as most suitable. Therefore, DNA extracts obtained with this protocol prior to real-time PCR analyses were diluted in concentrations 100, 50, 10, 1, 0.1, 0.01 and 0.0027 ng/μl, in order to determine the LOD–Limit of detection and LOQ-Limit of quantification (
15). LOD is the lowest DNA concentration at which a positive signal of amplification is detected, despite the number of positive reactions, while LOQ is the lowest DNA concentration at which all six replicates give amplification signal.
 Real-time PCR screening of 35S promotor and Tnos terminator
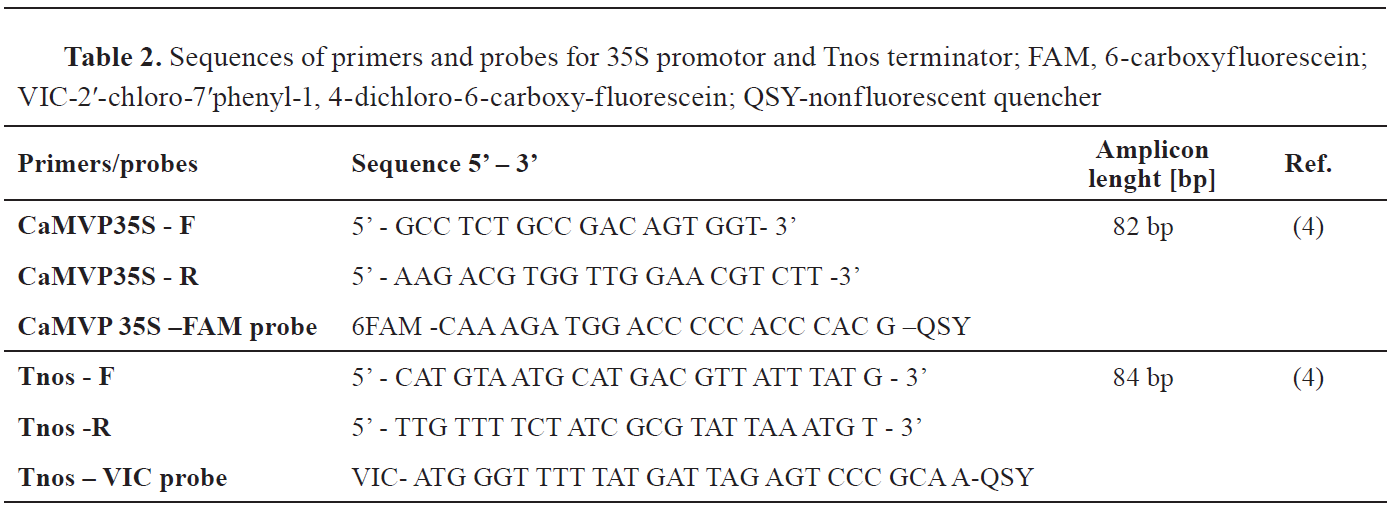
Rotor-Gene Q (Qiagen, Germany) was used for performing real-time PCR analyses. Both targets were screened in a final volume of 25 μl duplex reaction, containing 12.5 μl TaqMan® Universal PCR Master Mix (Thermo Fischer Scientific), primer volume of 0.25 μl (10 μМ) and 2.5 μl (10 μМ) for 35S and Tnos, respectively. Probes labelled with FAM and VIC were added to the reaction mix in final concentrations of 0.1 μmol/l and 0.2 μmol/l, for 35S and Tnos, respectively. Primers and probes used were synthetized by Invitrogen (Thermo Fisher Scientific). Their sequences are given in
Table 2 (16). To determine if the extracted DNA contains amplification inhibitors, an Internal Positive Control – IPC (TaqMan® Exogenous Internal Positive Control, Thermo Fisher Scientific, USA) was used.
The real-time PCR program was: 10 min at 95 °C (activation of Hot start Taq-polymerase), followed by 45 cycles with 15s at 95 °C and 60s at 60 °C.
RESULTS
The results for DNA yield and purity, obtained with the three modifications to the SDS protocol were compared to the protocol without
RNase A enzyme (
Table 3). There is a decrease for the A260/280 value, especially in roasted soybean, from 2.04±0.03 when the sample is not treated with
RNase A enzyme, to 1.78±0.01, as closest value to the optimal 1.8, obtained by protocol C.
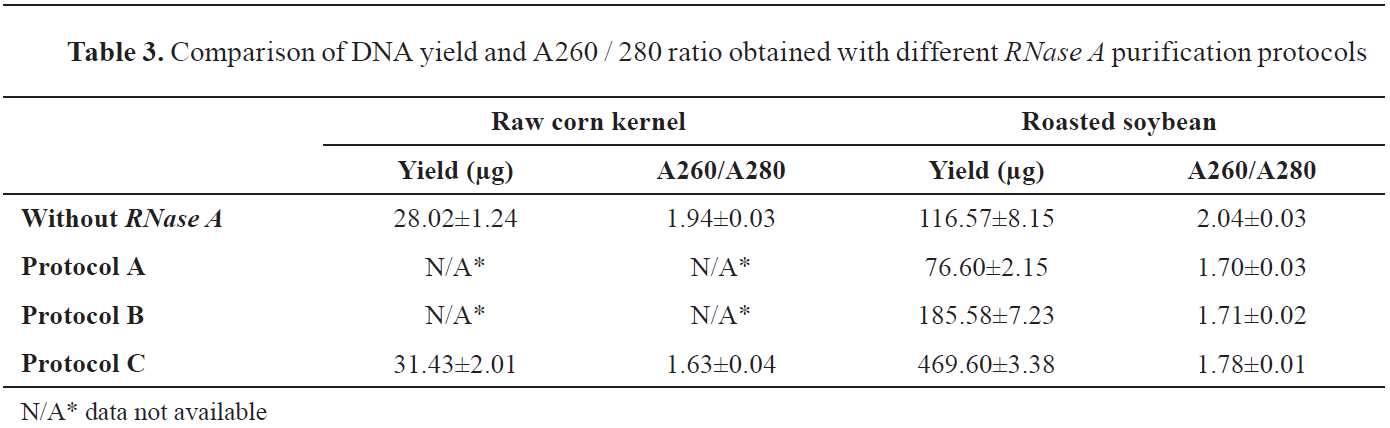
According to our results, in roasted soybean, protocol C, at the same time, showed the highest DNA yield (469.60±3.38 μg) and the purest extract according to the A260/280 ratio. DNA yield in raw corn kernels was higher with protocol C, compared to the protocol without
RNase A enzyme.
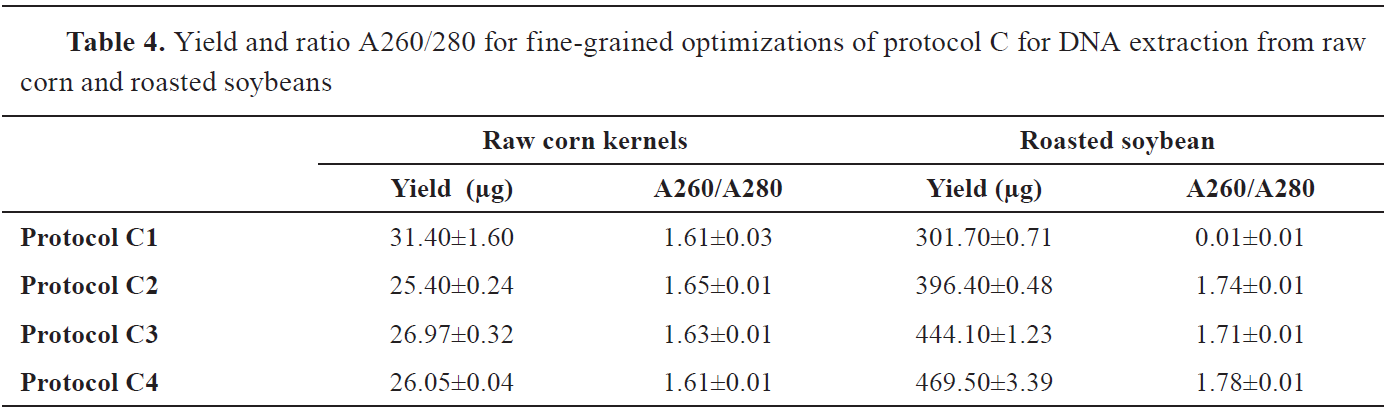
According to the yield results and the ratio A260/280 of the protocols C1 to C4 given in
Table 4, a significant effect of the enzyme volume and incubation time in raw corn kernels was unobserved. On the contrary, in roasted soybean, there were differences in DNA yield and purity between the protocols, where the highest yield of 469.50±3.39 μg and purity of 1.78±0.01 at A260/A280 was obtained with C4 protocol.
In the analysis of DNA integrity with agarose gel electrophoresis, in raw corn kernels, wellseparated bands of high molecular weight genomic DNA can be spotted with all protocols (
Fig. 1A). While in roasted soybean, all extraction protocols gave DNA band smearing (
Fig. 1B).
In addition, in order to evaluate the successful extraction of DNA from raw corn kernels and roasted soybean by the C4 method, detection of genetic modification presence followed. For that purpose, DNA extracts were subjected for screening of the 35S promoter and the Tnos terminator by real-time PCR. Amplification of 35S promotor was read on the FAM-green channel, while the presence of Tnos, amplification was read on the VIC-yellow channel. Because the Internal Positive Control-IPC is also read on VIC-yellow channel, and additional reaction wheel containing the reaction master mix plus IPC, was introduced to the real-time PCR setup. Initially, the DNA extracts were analyzed at concentrations of 100 ng/μl, 50 ng/μl and 10 ng/μl, in duplicates. For both matrices, a positive signal for 35S and Tnos amplification, at all analyzed concentrations was acquired. After this, determination of the smallest concentration at which amplification could be detected followed. These results would also be useful for the analysis of mixed matrices when the composition and percentage of genetically modified raw materials are unknown and very small. Therefore, the next step of the analysis was dilution of the initial DNA sample starting from 10 ng/μl, 1 ng/μl, 0.1 ng/μl, 0.01 ng/μl and 0.0027 ng/μl. As in very low concentrations, the probability of error increases, all dilutions were processed in six replicates. The lowest concentration would be the one at which all six replicates have a positive fluorescence signal for a given target gene.
From the displayed results in
Table 5, for amplification of the 35S promoter in raw corn kernels DNA, in concentrations from 10 ng/μl to 0.0027 ng/μl, it can be seen that up to 0.1 ng/μl all six replicates have a positive signal. This means that up to that DNA concentration, the presence of GM in the analyzed sample can be quantified with certainty, being the quantification limit (LOQ). At the analyzed concentrations of 0.01 ng/μl 4/6 replicates gave positive signal while at DNA concentration of 0.0027 ng/μl 2/6 replicates showed positive signal.
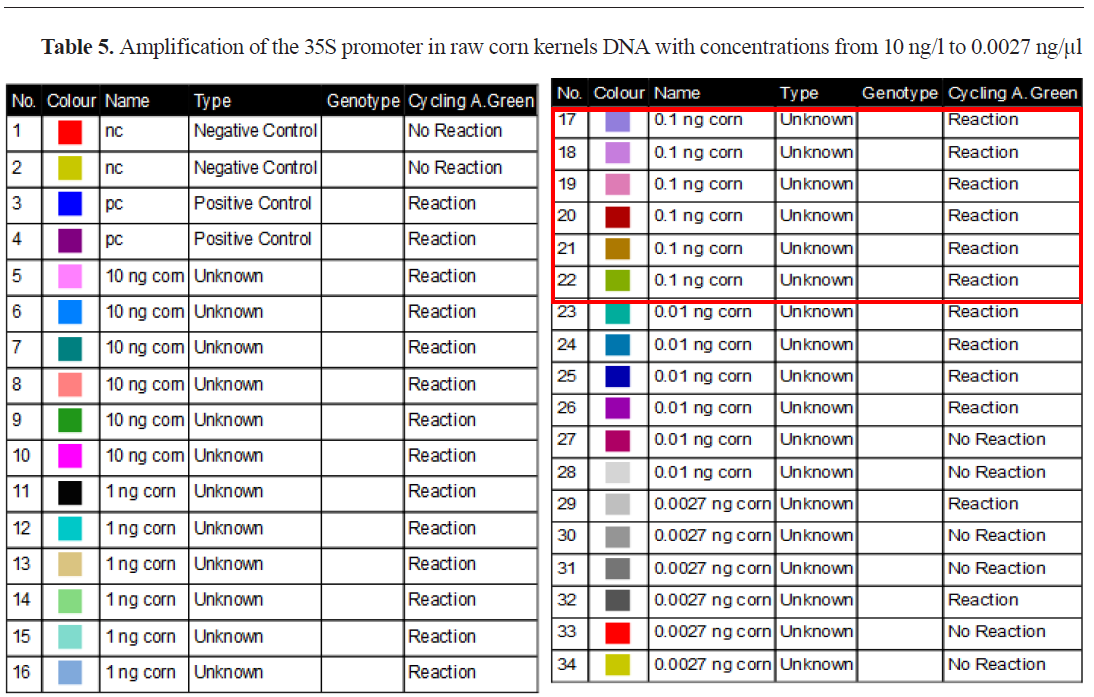
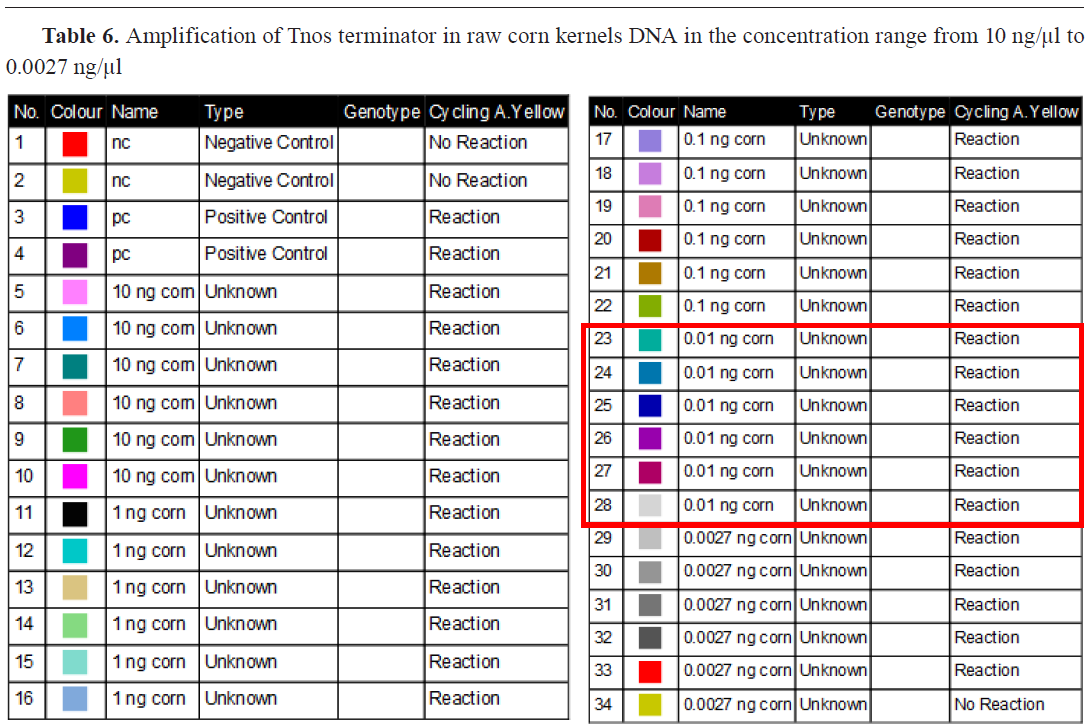
This means that our method can detect concentrations lower than 0.1 ng/μl, if the analyzed sample is 100% GMO, but it is not possible to quantify with certainty how much it is present in the analyzed sample. This value represents the detection limit (LOD). If we convert those concentrations into copies of the haploid genome. This confirms that the method is sensitive genome (cp) of maize, given that the 1C value of maize is 2.72 pg, then a concentration of 0.01 ng/μl contains 3.7 cp while 0.0027 ng/μl contains only one copy of corn haploid enough to detect the presence of only one copy of the 35S promoter sequence in the analyzed sample if it is 100% genetically modified. As for the Tnos terminator in raw corn kernels, amplification is present in 6/6 at 0.01 ng/μl template DNA, making it the LOQ, and in 5/6 at concentration level 0.0027 ng/μl, being the LOD value for this target (
Table 6). Contrarily to the LOQ values for Tnos in raw corn kernels, in roasted soybean positive signals were obtained in 6/6 at concentration level of 0.1 ng/μl. The same value was gained for 35S promotor as well. LOD level for both 35S and Tnos in roasted soybean was 0.0027 ng/μl (
Table 6).
Additional verification that the DNA sample extracted with the in-house developed C4 protocol does not contain inhibitors is the amplification of the Internal Positive Control-IPC. We used undiluted corn DNA, dilution of 100 ng/μl and 10 ng/μl, negative controls and positive controls. IPC showed positive signal of amplification on VIC channel in all reaction tubes (
Fig. 2), while in the reaction tube containing the NTC - no template controls, there were no reactions, which confirms that there is no contamination of the master mix.

DISCUSSION
The extraction of DNA with good purity and yield represents the ultimate goal for any researcher, despite the task, but especially for successful DNA specific target sequence amplification by real-time PCR. The efficiency of the DNA extraction step can be critical for successful amplification since many compounds that inhibit DNA amplification are extracted along with the DNA, such as polysaccharides, lipids and polyphenols (
17) or extraction chemicals like CTAB (
7, 8, 9, 11). Currently, there are many specialized methods used for DNA extraction, but those based on SDS and CTAB lysis buffer are mostly used. The protocol described in this paper represents a modification of a previously optimized SDS protocol (
12). A ratio of ~1.8 is generally accepted as “pure” for DNA, so in the SDS optimized protocol without
RNase, higher values for the A260/280 ratio could be due to the presence of RNA molecules released along with DNA molecules during cell lysis. Both nucleic acids absorb UV light at the same wavelength λ=260 nm (
11, 12), resulting in overestimation of DNA concentration with spectrophotometric determination. Therefore, in order to improve the quality of extracted DNA,
RNase A enzyme treatment was included in the extraction protocol. Based on the literature,
RNase A treatment often is performed on a buffer suspended genomic DNA, but additional steps are required for enzyme purification which extends DNA extraction time. Haeley at al. (
13) performed
RNase A step between two steps of chloroform/ isoamyl alcohol extraction followed by 15-minute incubation at 37 °C. While Abdel-Latif and Osman (
14) have purified genomic maize DNA with RNase A enzyme right after cell lysis with 10-minutes incubation at 65 °C. These literature findings lead us to perform three modifications (named as A, B and C) according to the step when
RNase A enzyme is administered.
Results for DNA yield and purity (
Table 3) have proven that protocol C, where
RNase was added along with the lysis buffer, to be most efficient. Therefore, the next step was to optimize the amount and incubation time of the
RNase A enzyme. Best results were achieved by adding 10 μl
RNase A to the lysis buffer, followed with 30 min incubation at 65 °C. With this protocol the amount and time of incubation did not had any significant affect upon corn DNA yield and purity, while in roasted soybean it was proven to give best results. Concerning DNA integrity, gel electrophoresis showed smeared bands for roasted soybean (
Fig. 1B) even though the smear was less blurred than in the protocol without
RNase A enzyme (
12). Thermal processing could affect DNA integrity and stability, causing fragmentation of the genomic DNA (
18).
Adding of
RNase A enzyme lowers the value of the A260/280 ratio, because the enzyme cleaves cellular and other kinds of RNA from the sample. Decreased A260/280 value was observed both in raw corn kernels and processed soybean. An asset to
RNase employment in RNA contamination removal was increased yield for both matrices. The research of El-Ashram et al. (
19) where they used RNase to remove contaminant RNA from DNA extracted from different prokaryotic and eukaryotic sources, strongly supports our findings, so do the results of the research where
RNase was used to purify DNA extracted from mealybugs (
20). Therefore, the purity of DNA extract was our main goal of optimization in developing this extraction protocol.
Due to the polyploidy of plants, when extracting DNA from plant tissues a solid yield can be obtained (
21). The key problem with DNA extraction from plant tissues is the presence of carbohydrates, phenolic compounds or other bioactive compounds that inhibit Taq polymerase during further analysis by real-time PCR (
11). Contrarily, the large amount of DNA acts as an inhibitor of polymerase due to the limited concentration of primers added to the reaction itself (
22). Thus, DNA was diluted at concentrations of 100 ng/μl, 50 ng/μl, 10 ng/μl. As shown in
Fig. 2, when amplifying the Tnos terminator at a DNA concentration of 100 ng/μl the fluorescence signal level is lower than the other two DNA concentrations. This may be due to the presence of inhibitors that reduce the effectiveness of the Taq polymerase enzyme while in the case of 50 ng/μl and 10 ng/μl, the dilution of the sample itself reduces the amount of inhibitors in the sample (
22). Therefore, additionally, the primarily extracted DNA was diluted at concentrations of 1 ng/μl, 0.1 ng/μl, 0.01 ng/μl and 0.0027 ng/μl. The positive signals for amplification for both DNA target sequences in both matrices at the lowest concentration proved that DNA extracts obtained with this protocol are suitable for real-time PCR analyses.
CONCLUSION
From the data presented in this research, it was observed that DNA quantity and quality depends on the type of food and the extraction method. So, the
RNase A enzyme represents an inevitably crucial step in obtaining DNA extract suitable for real-time PCR detection of GMO in raw and processed foods. The results from the real-time PCR analyses showed amplification of 35S and Tnos in both matrices, in concentrations of 0.0027 ng/μl template DNA, equivalent to 1 cp target DNA sequence. Therefore, this modification of the previously optimized SDS protocol could be used as a reliable method providing DNA extract valid for GMOs detection in raw and processed foods.
CONFLICT OF INTEREST
The authors declare that they have no potential conflict of interest with respect to the authorship and/or publication of this article.
ACKNOWLEDGMENTS
This research was supported by the Food Institute at the Faculty of Veterinary Medicine – Skopje.
AUTHORS’ CONTRIBUTION
ASH conceived the study and wrote the manuscript. KB contributed with the practical performance of the study and supervised all the stages of the study. GI contributed to the practical performances of this research. KB, GI and DJ contributed in giving critical revisions to the final version and performance of the manuscript.

 10.2478/macvetrev-2021-0028