The health condition of the mammary gland is highly crucial for obtaining good quality colostrum. The lactoferrin (LF), as an iron-binding protein, plays a key role in the defense mechanisms of the mammary gland due to its’ bacteriostatic properties. The study aimed to investigate the factors affecting the LF concentration in the bovine colostrum milk during the postpartum period, and the effect of somatic cell count (SCC) on the LF concentration and milk composition. The cows were randomly selected at a dairy farm in Pelagonia region. Colostrum samples from 12 cows were collected. Samples were taken at different time intervals after parturition, 1, 6, 12, 24, 48, 72, 96, and 120 h after parturition. Cows in their second parity were found to have higher levels of LF compared to cows in the third and higher parity (p>0.05). Time had a significant effect on the LF concentration (p<0.01), with the highest value recorded 1 h after parturition remaining stable for one hour. LF concentration and SCC in the colostrum showed a weak positive correlation (r=0.40; p<0.01). The highest LF concentration was noticed when SCC was above 800,000 cells/mL. In conclusion, the colostrum LF concentration was significantly affected by the interactions of the two factors, i.e., time after parturition and SCC (p<0.05). Milk composition was affected by elevated SCC. Parity showed no association with LF. The SCC can be used as a reliable means of assessing colostrum quality.
The concentration of the lactoferrin (LF) in the bovine colostrum (as an iron-binding glycoprotein) is significantly lower (820 μg/mL) compared with human colostrum (10,580 μg/mL) (
6), with individual variations ranging from 100 to 2,200 μg/mL (
7). It is well documented that iron is not only an essential nutrient for the growth of the calves but it is also an essential nutrient for many different kinds of bacteria (
8). LF is one of the several iron-carrying proteins which have a transport and preserving role for the iron. However, free iron in the body may promote production of free radicals, which can result in tissue damage. Bacterial growth can be impaired by limiting the free iron concentration (
8), i.e., higher LF concentration is correlated with a longer lag phase (
9).
The composition and physical characteristics of colostrum depends on many factors such as age, parity, breed, diet, vaccination status, and history of diseases (
10, 11). Rocha et al. have concluded that parity is an important factor in relation with LF concentration (
11). The concentration of the LF in colostrum milk in highly lactating cows is four times higher (2,000 μg/mL) than in the fattening breeds (500 μg/mL) (
12, 13). According to Tsuji et al. (
13), the highest concentrations of LF were obtained in the Holstein Frisian cows (1,960 μg/mL) and Jersey (2,110 μg/mL), while the milk of other breeds, Japanese black and Japanese gray contained significantly lower concentrations of LF (560 μg/mL and 400 μg/mL, respectively). Having in mind the above, the aim of this study was to investigate the factors affecting the LF concentration in the bovine colostrum milk during postpartum period.
MATERIAL AND METHODS
AnimalsColostrum was obtained within five days postpartum from the Holstein-Friesian cows (n=12), which were randomly chosen from a dairy farm in the Pelagonia region, North Macedonia during the summer season. Before each sampling, clinical status of the cow, udder, the time of parturition, and sampling were recorded. All the cows were housed under the same conditions in a tie stall barns. All cows were provided with a total mixed ration (TRM) drug-free diet and water
ad libitum. The cows were milked twice daily with pipeline milking system. The average milk production was 7,500 liters of milk for 305 days of lactation.
Milk samplesDuplicate milk samples from each cow were collected on the sampling day. Each sample set (50 mL) was analyzed for its composition (milk fat, protein, lactose, solids non-fat - SNF) and somatic cell count (SCC). Another set of milk samples (30 mL) were used for the determination of LF concentration. Samples were taken at different hours after parturition till fifth day postpartum. At day one of the postpartum, five colostrum samples were collected (after parturition, 1, 6, 12, and 24 hours after parturition). The rest of the samples were taken at 48 hours (2nd day), 72 h (3rd day), 96 h (4th day), and 120 h (5th day) postpartum.
MethodsMilk composition was determined with Lactoscope C4+ (Delta Instruments B.V, Drachten, the Netherlands), according to ISO 9622: 1999 standard (
14). SCC was performed by flow cytometry with Somacount CC 150 (Bentley Instruments, Inc., Chaska, Minnesota, U.S.A.). Milk-enumeration of SCC was in accordance with the MK EN ISO 13366- 2:2010 standard (
15). The quantitative determination of LF was made by the ELISA method with commercial immunoenzyme test Bovine Lactoferrin ELISA kit (Biopanda Reagents, Belfast, The United Kingdom), aspreviously reported (
16, 17). Milk samples were previously skimmed by centrifugation on 2-8 °С at 3000 rpm in period of 20 minutes (MPW – 352 R). The plates were read on wavelength λ=450 nm by using Microplate reader Model 680 (BioRad, Hercules, California, U.S.A.). All procedures were performed according to manufacturer’s instructions. The dilution factor of the samples was 1,000. The ELISA method was validated prior the analysis. The performance characteristics in the validation study included linearity, sensitivity, and precision of the method.
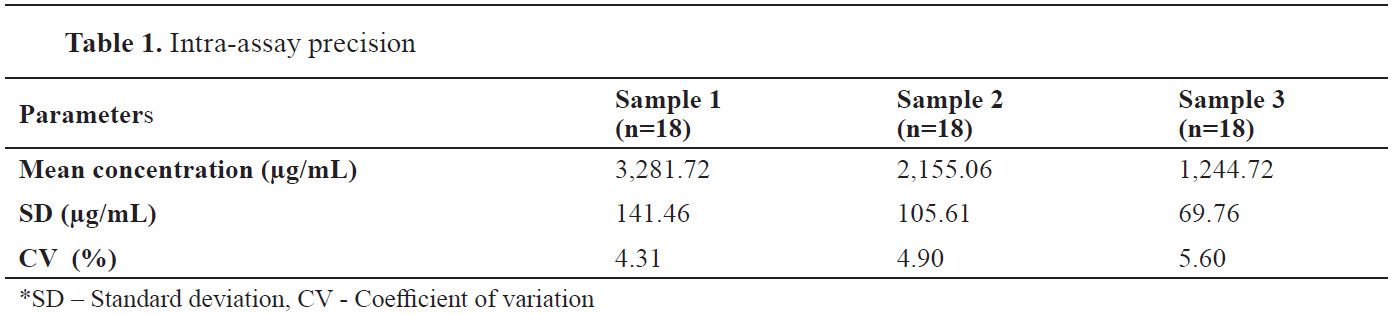
The sensitivity of the method was assessed through the limit of detection (LOD). The LOD was determined with analysis of 20 blank samples (diluent buffer). The LOD was calculated as the mean signal of the blank samples plus 3 times of the standard deviation (SD). The LOD was 11.5 ng/mL. The precision of the method was determined as intraassay precision and inter-assay precision. Precision was expressed as the CV (Coefficient of variation), %. Intra-assay precision shows the reproducibility between wells within ELISA kit, while inter-assay precision shows the reproducibility between ELISA kits done on different days. Intra-assay precision was evaluated by testing three samples in the same kit. Each sample was tested in 18 replicates.
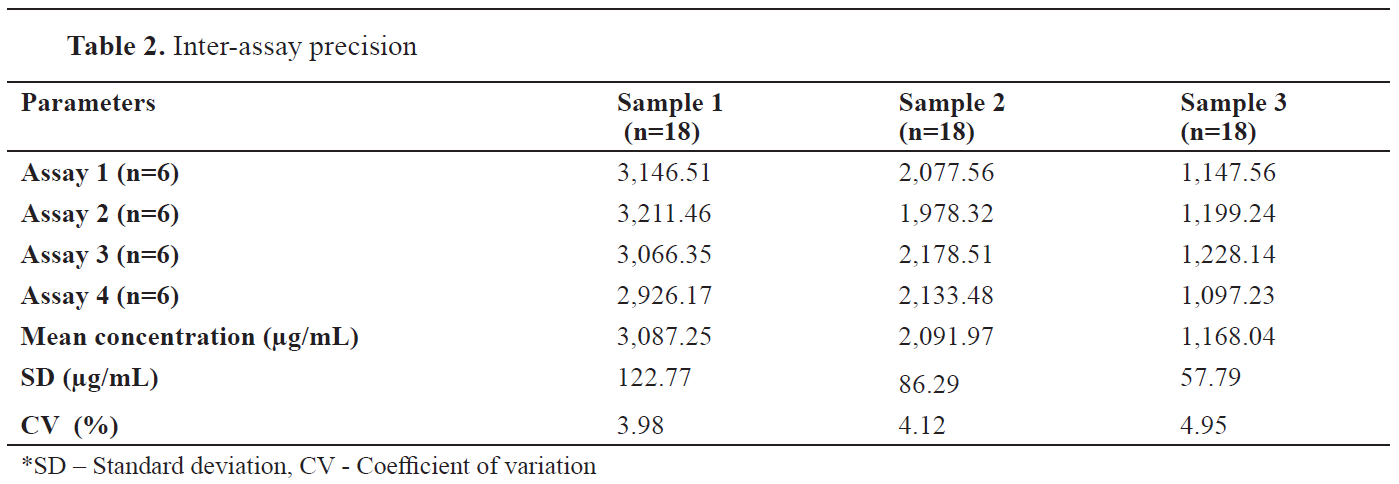
Inter-assay precision was evaluated by testing three samples in four separate ELISA kits, from the same manufacturer. Each sample was tested in 6 replicates per kits. The CV was from 3.98 to 4.95%.
Statistical analysisThe milk samples were classified on the basis of parity (second parity - L2, - third parity - L3, and forth, and above parity - L4+). Also, samples were classified on the basis of somatic cells (SCC-1 - up to 400,000 cells/mL, SCC-2 - from 400,001 to 800,000 cells/mL, and SCC-3- above 800,001 cells/mL). The statistical software SPSS 15.0 for Windows (Chicago, SPSS Inc.) was used for the statistical analysis. The results are presented as mean values and standard error of mean (mean ± SEM). The significance of differences in the milk LF concentration among groups was analyzed by the one-way ANOVA. Moreover, a factorial ANOVA was conducted with p<0.05 considered significant and those p<0.01 and p<0.001 considered highly significant. The correlation coefficients among groups were analyzed by the Spearman’s correlation coefficient.
RESULTS
Validation studyThe calibration curve was determined at eight different concentration levels as follows: 0 (diluent buffer – blank,), 7.8125, 15.625, 31.25, 62.5, 125.0, 250.0, and 500.0 ng/mL. The coefficient of correlation (R2) was 0.9935. The calibration curve is given in
Fig. 1.
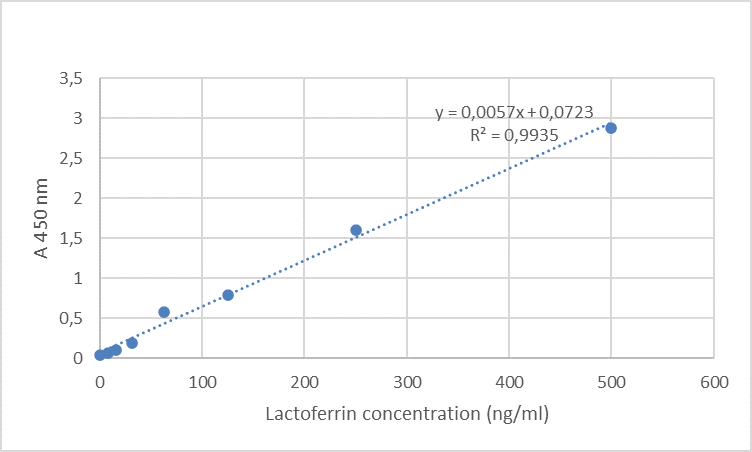 Figure 1.
 Calibration curve of lactoferrin
The CV from intra-assay precision was from 4.31 to 5.60%. The results are given in
Table 1. The CV inter-assay precision was from 3.98 to 4.95%. The results are given in
Table 2.
 Factors of LF concentration variations in colostrum milk
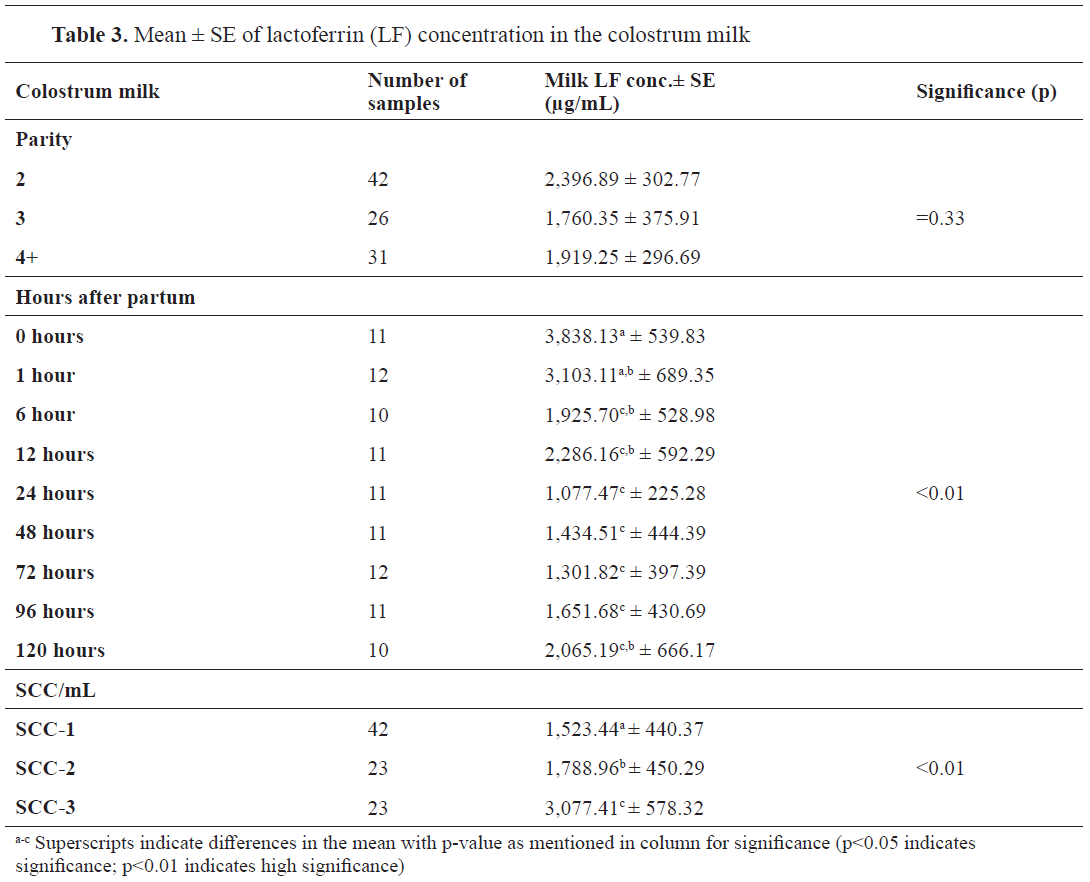
The LF concentration in the colostrum milk did not differ significantly by parity (p=0.33). The concentration of the LF was found to be higher at second parity compared to parity >3. LF concentration was observed to change with each hour wherein the value decreased over a period of time (p<0.01) (
Table 3). Time was the critical element for the changes in this parameter. The highest concentration was noticed immediately after parturition 3,838.3 μg/mL and remained stable after 1h postpartum (3,103.11μg/mL) (p>0.01). The concentration of LF decreased constantly till 96 h postpartum to 1,651.68 μg/mL (p<0.01). On the fifth day postpartum (120 hours), the LF concentration increased to 2,065.19 μg/mL. In addition, the increased SCC in the colostrum was associated with higher LF concentrations (p<0.01).
The distribution of the milk LF concentration in the colostrum samples is presented in
Fig. 2.
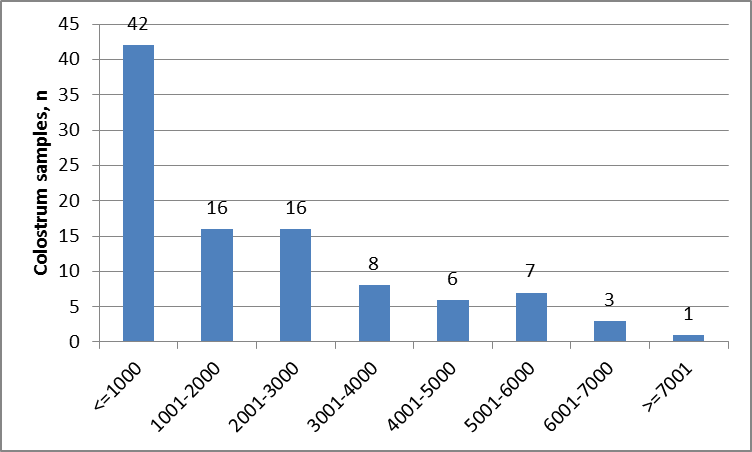 Figure 2.
 Distribution of LF concentration (μg/mL) in colostrum milk
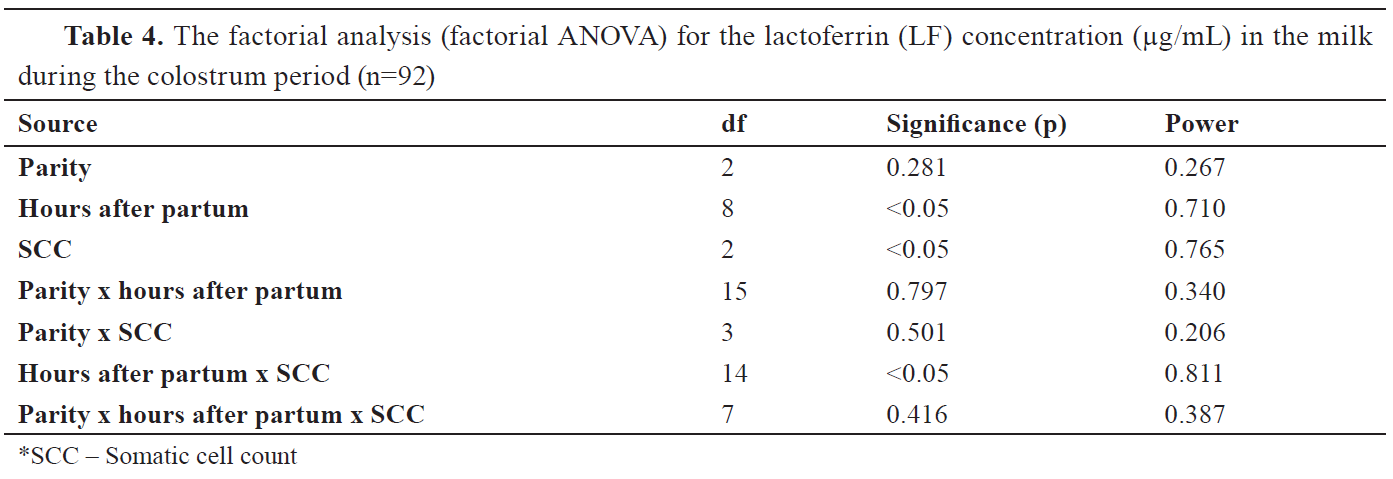
The majority of colostrum samples contained LF <1,000 μg/mL. According to the factorial analysis presented in the
Table 4, the hours after parity and SCC significantly influenced the milk LF concentration (p<0.05). Milk LF concentration was also significantly affected by the interactions of these two factors (
Table 4).
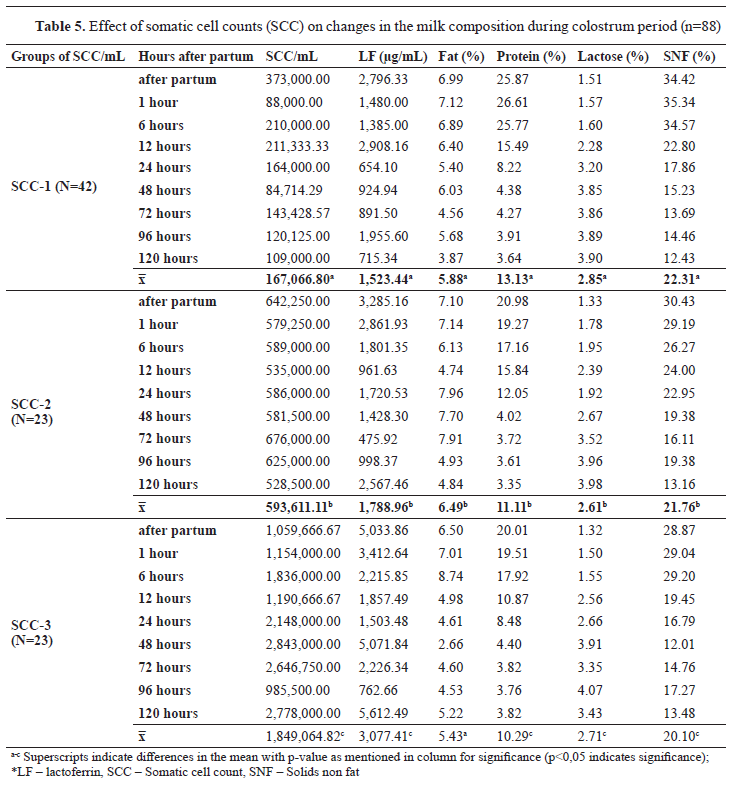
In addition, significant differences (p<0.05) were noticed comparing colostrum among all three groups of SCC. The protein concentration was found to be 25.87% in the first milking colostrum in group SCC-1, 20.98% in the samples in group SCC-2, and 20.01% in the SCC-3 samples (p<0.05). On the other hand, milk fat varied during the time of sampling with significant difference between SCC-1 and SCC-2 (p<0.05). SCCs showed fluctuations between groups which were significantly different. The LF concentration was observed to be high postpartum in all three groups except in SCC-1 which remained stable at 120 h postpartum and was significantly different compared to the other two groups. In SCC-2 and SCC-3, the concentration of LF was increased to 2,567.46 μg/mL and 5,612.49 μg/mL, respectively. This increment in the LF concentration was accompanied by an increase in the SCC in group SCC-3 (
Table 5).
DISCUSSION
The validation of the methods was of critical and fundamental significance for the accuracy and quality of the gained results. The results indicated successful validation. A linear regression analysis showed good correlation in the concentration range with R2 0.9935. The low sensitivity of the method (LOD=11.5 ng/mL) provided detection of LF at low concentration levels. The low CV for intra-assay and inter assay precision, from 4.31 to 5.60% and 3.98 to 4.95%, respectively, indicated good precision of the method. According to gained results, the method was considered suitable for determination of lactoferrin in milk samples.
The results of this research indicated that there was a lower LF concentration in higher cow parity. Similar results were reported by Tsuji et al. (
13) where it was concluded that the highest average LF concentration was observed in the second lactation and that the differences between primiparous and multiparous cows were due to the greater degree of intramammary infection in the multiparous cows.
The changes in the LF concentration in the colostrum over a period of time after calving were more pronounced on the first day. Sobczuk-Szul et al. (
18) observed highest LF concentration in the first day colostrum (1 h postpartum) compared to the second and subsequent milking runs. Vojtech et al. (
19) have also reported the highest LF concentration 24 h postpartum. The individual LF variation (
13, 20) could be attributed to different farm management practices (
7). These LF variations (including other functional proteins) in the colostrum can affect the health of the calves (
21). LF as an iron-binding protein in the colostrum (
21) could contribute to lower mortality and improved growth in calves (
22). Iron is an essential element for normal growth of Gram-negative bacteria (e.g.,
Escherichia coli,
Salmonella), thus removing it from their environment inhibits their growth (
21). In our research, the LF concentration decreased constantly after parturition until the 4th day postpartum and started to increase on the fifth day postpartum. This slight significant increase in the LF concentration could be due to intramammary infection. Similar results were presented by Trajkovska et al. (
23) reporting elevated SCCs on the 5th day postpartum as a result of intramammary infection. During mastitis and dry-off period, the concentration of LF in the milk can increase up to 30 times depending on the degree of infection (
14, 15, 24).
The colostrum usually contains large numbers of immune cells and SCC during the first 5-7 days after calving (
25). High SCC levels can be caused by stress during calving and increased susceptibility to udder infection especially in cows that have had a severe parturition, but also can be affected by parity, phase of lactation, and season (
26). There are numerous divided opinions about how many somatic cells should be present during the colostrum period. Ferdowski et al. (
27), stated that the average number of 960,000 cells/mL represent low values for somatic cells in this period, with medium SCC values of 2,138,000 cells/mL and high SCC values reaching to 5,051,000 cells/mL. However, no other data was found to support this assumption, but an increase in the SCC is generally associated with mastitis, even in the colostrums (
25). On the other hand, Puppel et al. (28) reported that good quality colostrum is the one which has SCC≤400,000 cells/mL. Increased levels of SCC in the milk can further rapidly affect the calf health in cases where nutrient assimilation could be hampered with onset of mild to severe diarrhea (
27). The highest values for somatic cells were obtained immediately after parturition (1,163,330 cells/mL), while the lowest values (299,500 cells/mL) were observed on the fourth day postpartum (
23). Also, the highest level of LF in our research was noticed when SCC were higher than 800,001 cells/mL.
According to Rice et al. (
29) elevated SCC may occur in the milk in late gestation and for a few weeks following calving, regardless of the infection status. This somatic cell elevation is a part of the natural immune system responsible for preparing the cow for the calving, in order to improve the defense mechanism of the mammary gland in this critical period. If there is no infection on the quarter, there is a significant decline of the SCC after few weeks postpartum. The intramammary infection is a strong indicator that the colostrum will contain elevated somatic cells (
25). Three mechanisms are responsible for the changes in colostrum composition as a result of intramammary infection: suppressed synthesis of colostrum components, increased permeability of blood-colostrum barrier and increased proteolytic/enzymatic activity (
30).
The results presented in
Table 5 show that the composition of colostrum changed over a period of time. Protein, lactose, and solids not-fat (SNF) concentration of the colostrum differs as a result of hygienic quality of the milk. At 48 h after parturition (2 days postpartum), its biological values dropped and we could see that these components were stabilized in the colostrum milk. Similar results were presented by Puppel et al. (
28), reporting that organic compounds and electrolytes started fluctuating within the udder secretion between the second and fifth day of lactation, after which their composition stabilized (
5). Compared to the milk, colostrum contains significantly higher amounts of protein (
31), especially immunoglobulins (Ig) and growth factors, therefore a higher concentration was noticed in the first milking colostrum at all three groups. Our data showed that the protein concentration was significantly influenced by the SCC (p<0.05). Puppel et al. (
28) found that differences in the protein concentration in colostrum was influenced by SCC. According to Ontsouka (
32), the protein content decreased significantly on the third postpartum day, with a highest decrease in the Ig fraction which has the highest values in the initial phase of colostrum secretion. In addition, a different group of proteins, including the nonspecific antibiotic agent LF, are present in the colostrum milk which is very significant in terms of the colostrum’s bacteriostatic and germicidal properties (
28). The concentration of LF decreased successively in the groups, only to be increased in the SCC-2 and SCC-3 groups as a result of increased SCC in the milk. Overall, our data clearly showed that the concentration of LF was significantly influenced by the number of SCC (p<0.05). On the other hand, Puppel et al. (
28) noticed a constant decrease in the LF concentration of the two SCC groups. This difference in the findings may be due to individual LF variations and different interpretation. But still, elevated SCC is generally associated with mastitis even in the colostrum milk (
27). Additionally, a weak positive correlation was noticed among LF and SCC (r=0.40; p<0.01).
The fat in the colostrum is an important component especially in the first day since it provides energy for maintaining body heat, gaining strength, muscle tissue development, and is a precursor for the synthesis of certain enzymes and hormones (
5, 33, 34, 35). The study of Puppel et al. (
28) reported different findings compared to the current study most likely due to the different sample grouping. The percentage of lactose in the colostrum was lower compared to the other components in the normal milk (
23, 36). This could be due to increased somatic cells which reduced synthetic activity of the mammary tissue (
18). Also, a negative correlation was noticed between lactose and SCC (r=-0.46; p<0.01). The percentage of solids not-fat (SNF) declined constantly and this parameter was also significantly influenced by the SCC. Similar results were presented by El-Fattah et al. (
37).
CONCLUSION
The LF concentration in the colostrum depended on the time after parturition and the SCC, whereas, parity showed no association. The highest value was recorded in the first milking colostrum remaining stable until one hour after parturition. The LF concentration in the milk had a positive correlation with the SCC. The high SCC affected the milk protein, lactose, solids non-fat, and fat composition. Therefore, it can be concluded that SCC can be used as an indicator of the colostrum quality.
CONFLICT OF INTEREST
The authors declared that they have no potential conflict of interest with respect to the authorship and/or publication of this article.
ACKNOWLEDGEMENTS
The authors would like to express their gratitude to all involved people from the farms in the Pelagonia region.
AUTHORS’ CONTRIBUTION
BT and LjK developed the design of the study and work concept. BT was involved in data analysis and interpretation of the results and she wrote the manuscript. ZHM supervised and organized the laboratory work. RU and BT conducted the laboratory work. GD and VP was involved in literature review. PCB was involved in interpretation of results and manuscript writing-editing.

 10.2478/macvetrev-2022-0026